
Report Comments
Student evaluations of teaching provide critical feedback to instructors that can be used to adjust
and improve the class experience.
This information is also evaluated as part of performance reviews.
You are encouraged to review this information to learn more about the student perspective and experience.
If you have any questions about the process or how to interpret this information, please contact the Office of Institutional Effectiveness and Planning at oiep@gmu.edu.
- Creation Date
- Sunday, June 6, 2021

| Raters | Students |
|---|---|
| Responded | 14 |
| Invited | 24 |
| Response Ratio | 58.33% |
| Competency | ||||
|---|---|---|---|---|
| Course | Standard Deviation | Min | Max | |
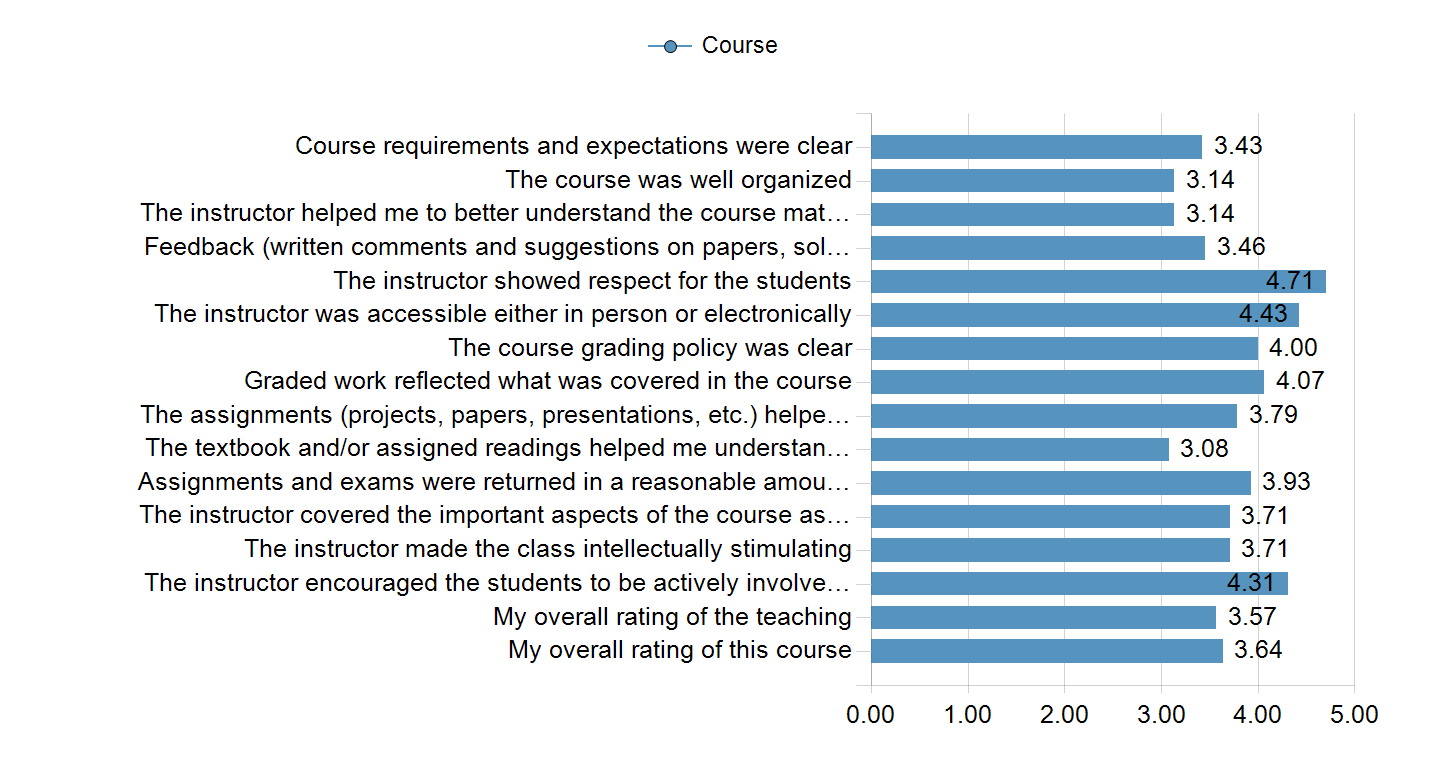
| Course requirements and expectations were clear | 3.43 | +/-1.02 | 2.00 | 5.00 |
| The course was well organized | 3.14 | +/-1.41 | 1.00 | 5.00 |
| The instructor helped me to better understand the course material | 3.14 | +/-1.17 | 2.00 | 5.00 |
| Feedback (written comments and suggestions on papers, solutions provided, class discussion, etc.) was helpful | 3.46 | +/-1.05 | 2.00 | 5.00 |
| The instructor showed respect for the students | 4.71 | +/-0.47 | 4.00 | 5.00 |
| The instructor was accessible either in person or electronically | 4.43 | +/-0.76 | 3.00 | 5.00 |
| The course grading policy was clear | 4.00 | +/-0.96 | 2.00 | 5.00 |
| Graded work reflected what was covered in the course | 4.07 | +/-1.00 | 2.00 | 5.00 |
| The assignments (projects, papers, presentations, etc.) helped me learn the material | 3.79 | +/-1.19 | 2.00 | 5.00 |
| The textbook and/or assigned readings helped me understand the material | 3.08 | +/-1.00 | 2.00 | 5.00 |
| Assignments and exams were returned in a reasonable amount of time | 3.93 | +/-0.92 | 2.00 | 5.00 |
| The instructor covered the important aspects of the course as outlined in the syllabus | 3.71 | +/-1.07 | 2.00 | 5.00 |
| The instructor made the class intellectually stimulating | 3.71 | +/-1.38 | 1.00 | 5.00 |
| The instructor encouraged the students to be actively involved in the material through discussion, assignments, and other activities | 4.31 | +/-0.85 | 3.00 | 5.00 |
| My overall rating of the teaching | 3.57 | +/-1.09 | 2.00 | 5.00 |
| My overall rating of this course | 3.64 | +/-0.93 | 2.00 | 5.00 |
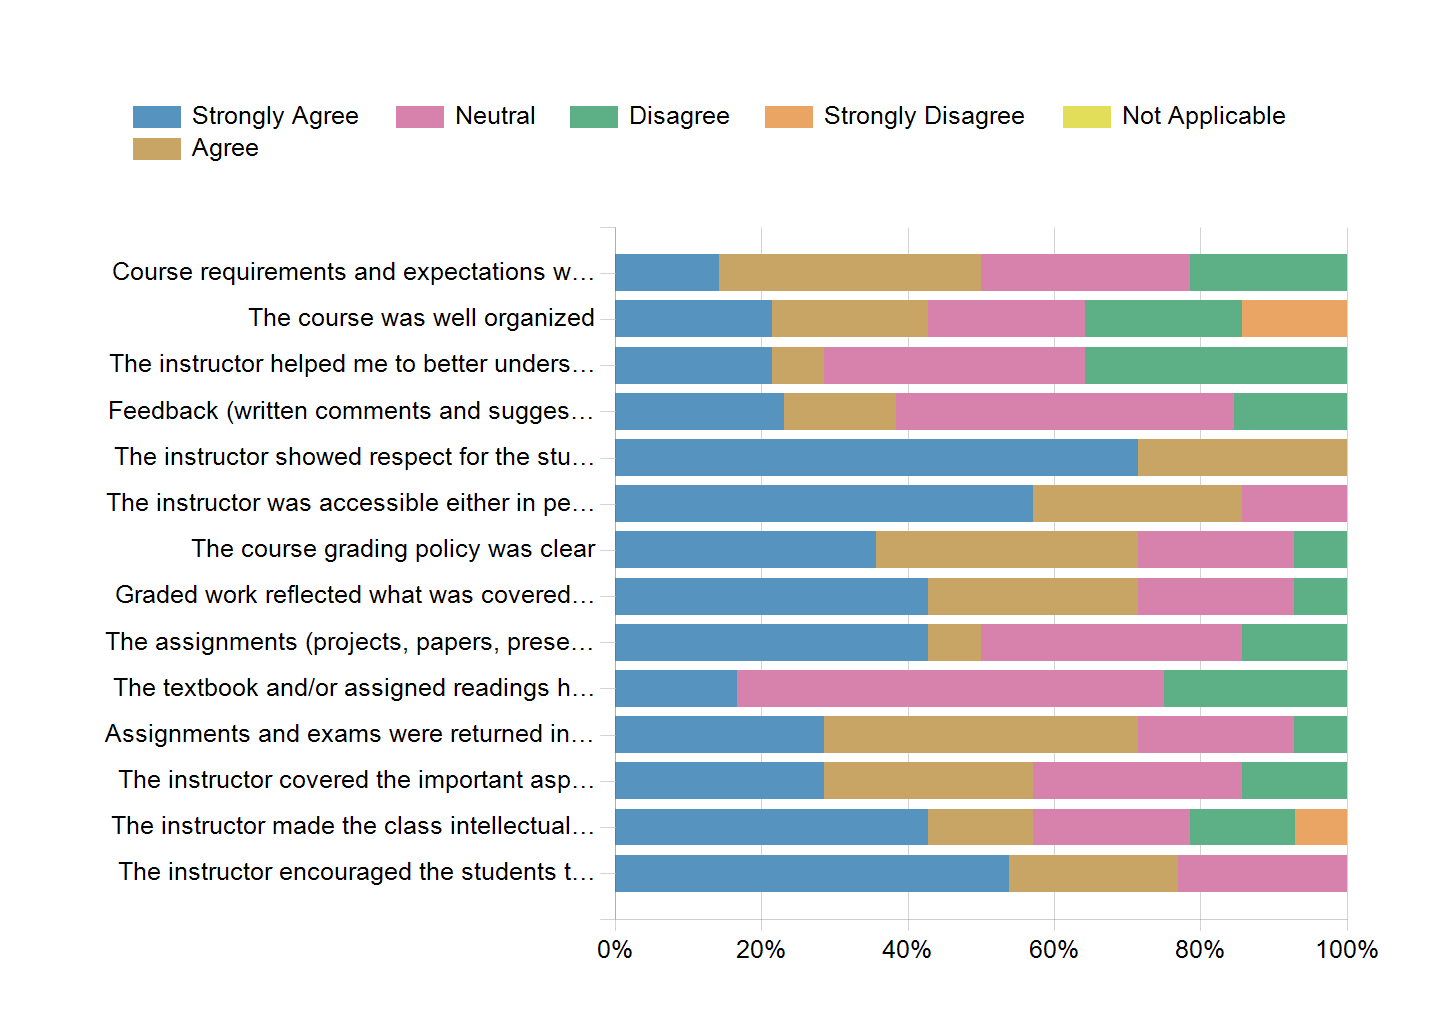
Student Evaluations of Teaching (Q1-Q14)
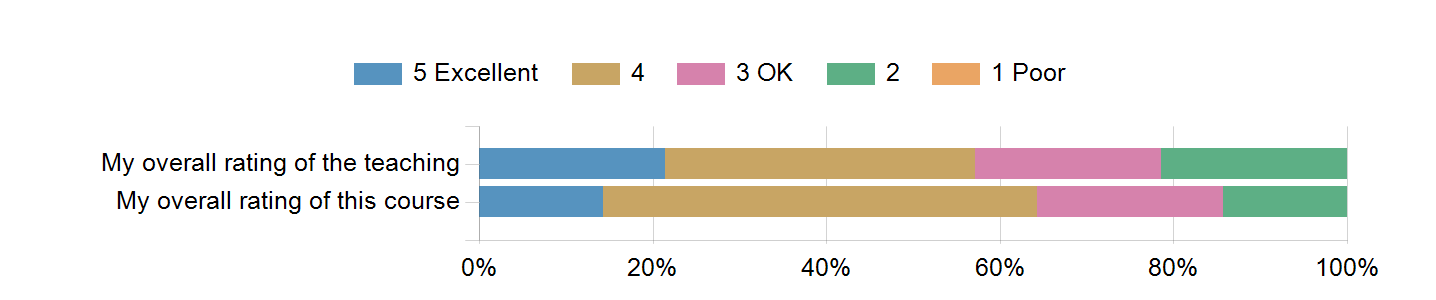
Student Evaluations of Teaching (Q15-Q16)
| Top Questions | ||
|---|---|---|
| 1 | The instructor showed respect for the students | 4.71 |
| 2 | The instructor was accessible either in person or electronically | 4.43 |
| 3 | The instructor encouraged the students to be actively involved in the material through discussion, assignments, and other activities | 4.31 |
| Lowest Questions | ||
|---|---|---|
| 1 | The textbook and/or assigned readings helped me understand the material | 3.08 |
| 2 | The course was well organized | 3.14 |
| 3 | The instructor helped me to better understand the course material | 3.14 |
Student Evaluations of Teaching (Q1-Q16)
| Question | Course | Department (Health Administration & Policy) | School (Health and Human Services) | |||||||||
|---|---|---|---|---|---|---|---|---|---|---|---|---|
| Response Count | Mean | Min | Max | Response Count | Mean | Min | Max | Response Count | Mean | Min | Max | |
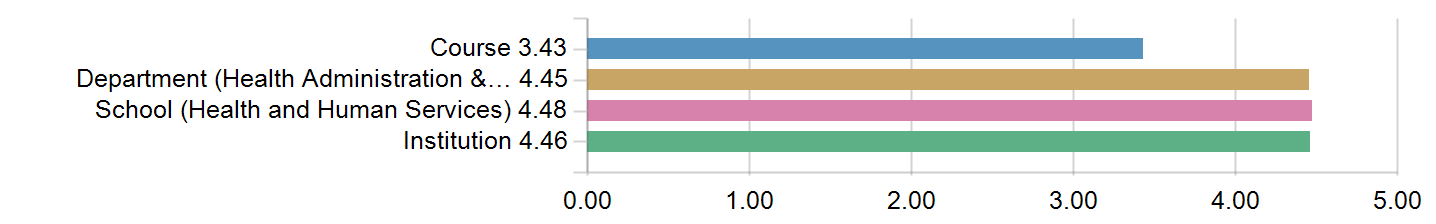
| Course requirements and expectations were clear | 14 | 3.43 | 2.00 | 5.00 | 863 | 4.45 | 1.00 | 5.00 | 3296 | 4.48 | 1.00 | 5.00 |
| The course was well organized | 14 | 3.14 | 1.00 | 5.00 | 866 | 4.40 | 1.00 | 5.00 | 3302 | 4.43 | 1.00 | 5.00 |
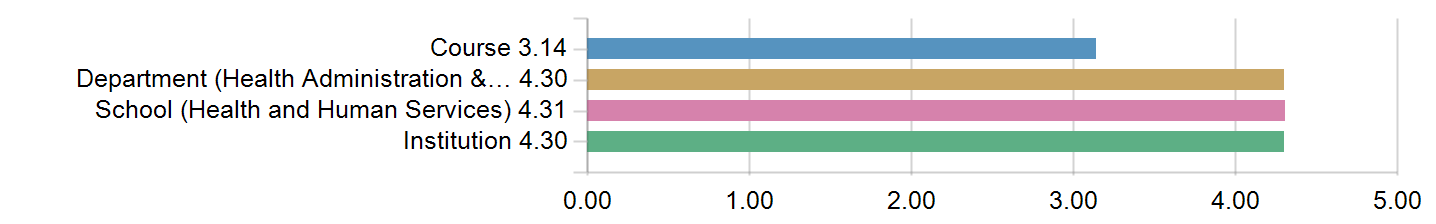
| The instructor helped me to better understand the course material | 14 | 3.14 | 2.00 | 5.00 | 863 | 4.30 | 1.00 | 5.00 | 3289 | 4.31 | 1.00 | 5.00 |
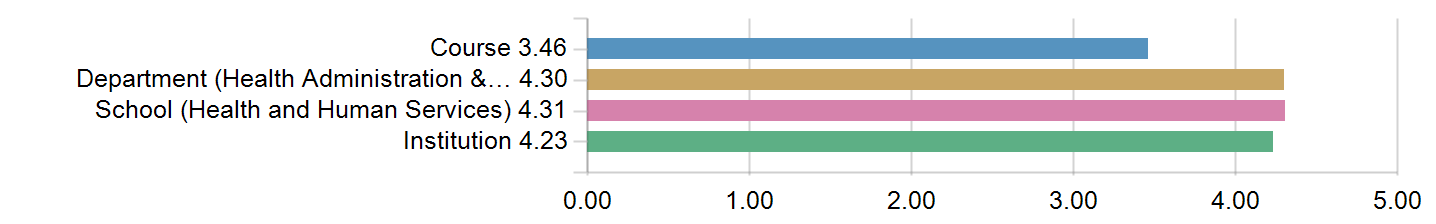
| Feedback (written comments and suggestions on papers, solutions provided, class discussion, etc.) was helpful | 13 | 3.46 | 2.00 | 5.00 | 855 | 4.30 | 1.00 | 5.00 | 3220 | 4.31 | 1.00 | 5.00 |
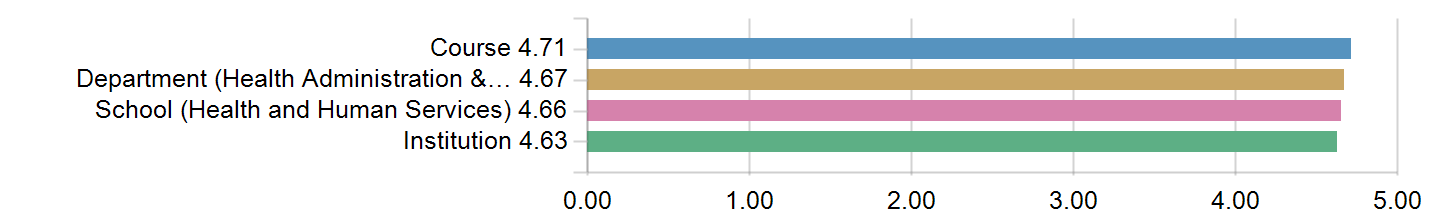
| The instructor showed respect for the students | 14 | 4.71 | 4.00 | 5.00 | 865 | 4.67 | 1.00 | 5.00 | 3285 | 4.66 | 1.00 | 5.00 |
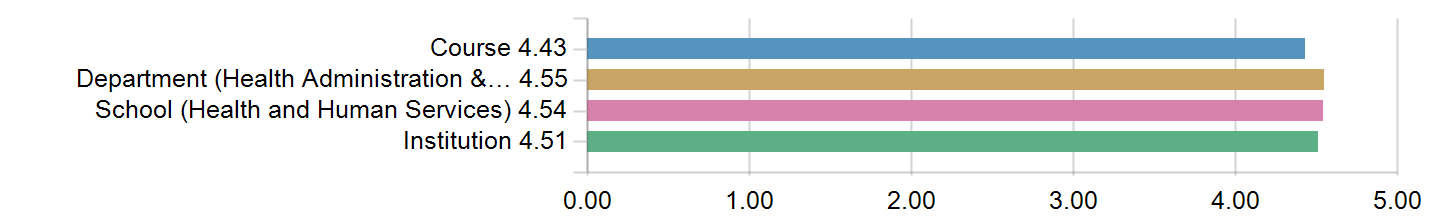
| The instructor was accessible either in person or electronically | 14 | 4.43 | 3.00 | 5.00 | 860 | 4.55 | 1.00 | 5.00 | 3273 | 4.54 | 1.00 | 5.00 |
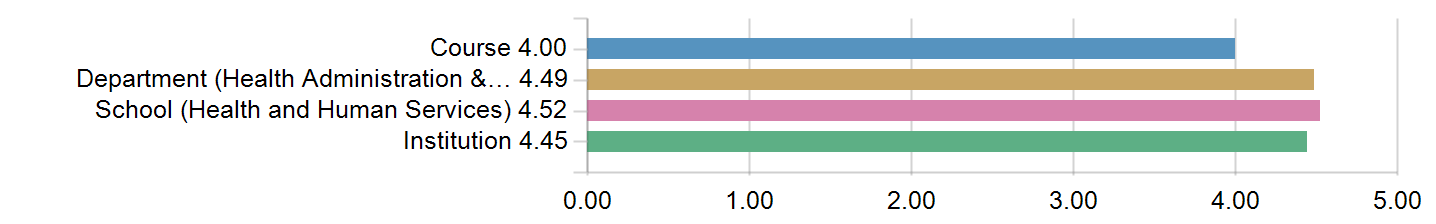
| The course grading policy was clear | 14 | 4.00 | 2.00 | 5.00 | 864 | 4.49 | 1.00 | 5.00 | 3294 | 4.52 | 1.00 | 5.00 |
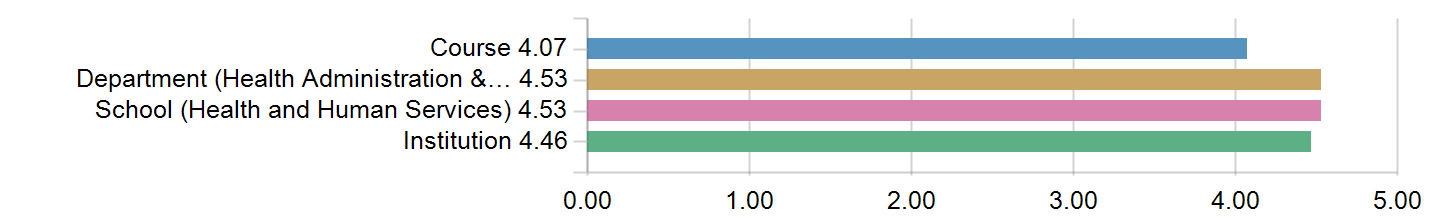
| Graded work reflected what was covered in the course | 14 | 4.07 | 2.00 | 5.00 | 859 | 4.53 | 1.00 | 5.00 | 3285 | 4.53 | 1.00 | 5.00 |
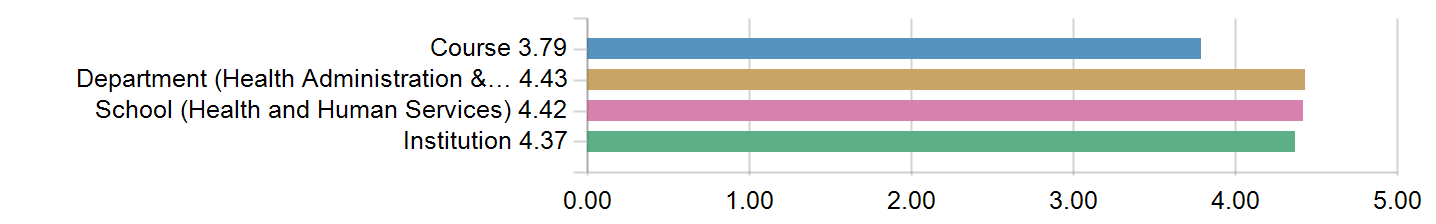
| The assignments (projects, papers, presentations, etc.) helped me learn the material | 14 | 3.79 | 2.00 | 5.00 | 859 | 4.43 | 1.00 | 5.00 | 3275 | 4.42 | 1.00 | 5.00 |
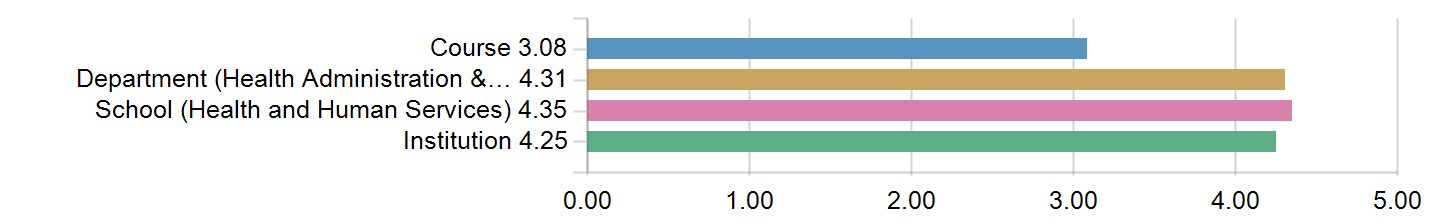
| The textbook and/or assigned readings helped me understand the material | 12 | 3.08 | 2.00 | 5.00 | 838 | 4.31 | 1.00 | 5.00 | 3180 | 4.35 | 1.00 | 5.00 |
| Assignments and exams were returned in a reasonable amount of time | 14 | 3.93 | 2.00 | 5.00 | 852 | 4.41 | 1.00 | 5.00 | 3238 | 4.45 | 1.00 | 5.00 |
| The instructor covered the important aspects of the course as outlined in the syllabus | 14 | 3.71 | 2.00 | 5.00 | 859 | 4.50 | 1.00 | 5.00 | 3285 | 4.51 | 1.00 | 5.00 |
| The instructor made the class intellectually stimulating | 14 | 3.71 | 1.00 | 5.00 | 853 | 4.28 | 1.00 | 5.00 | 3261 | 4.26 | 1.00 | 5.00 |
| The instructor encouraged the students to be actively involved in the material through discussion, assignments, and other activities | 13 | 4.31 | 3.00 | 5.00 | 855 | 4.48 | 1.00 | 5.00 | 3250 | 4.49 | 1.00 | 5.00 |
| My overall rating of the teaching | 14 | 3.57 | 2.00 | 5.00 | 862 | 4.37 | 1.00 | 5.00 | 3295 | 4.37 | 1.00 | 5.00 |
| My overall rating of this course | 14 | 3.64 | 2.00 | 5.00 | 861 | 4.31 | 1.00 | 5.00 | 3296 | 4.32 | 1.00 | 5.00 |
Student Evaluations of Teaching (Q1-Q16) (continued)
| Question | Institution | |||
|---|---|---|---|---|
| Response Count | Mean | Min | Max | |
| Course requirements and expectations were clear | 51483 | 4.46 | 1.00 | 5.00 |
| The course was well organized | 51639 | 4.37 | 1.00 | 5.00 |
| The instructor helped me to better understand the course material | 51311 | 4.30 | 1.00 | 5.00 |
| Feedback (written comments and suggestions on papers, solutions provided, class discussion, etc.) was helpful | 49871 | 4.23 | 1.00 | 5.00 |
| The instructor showed respect for the students | 51196 | 4.63 | 1.00 | 5.00 |
| The instructor was accessible either in person or electronically | 50989 | 4.51 | 1.00 | 5.00 |
| The course grading policy was clear | 51400 | 4.45 | 1.00 | 5.00 |
| Graded work reflected what was covered in the course | 50689 | 4.46 | 1.00 | 5.00 |
| The assignments (projects, papers, presentations, etc.) helped me learn the material | 50506 | 4.37 | 1.00 | 5.00 |
| The textbook and/or assigned readings helped me understand the material | 48703 | 4.25 | 1.00 | 5.00 |
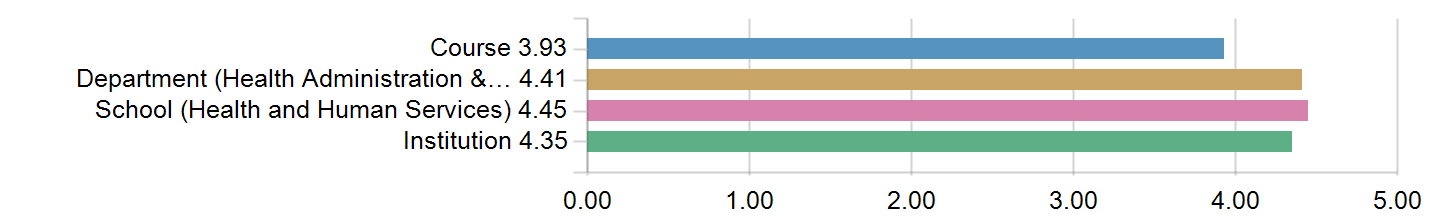
| Assignments and exams were returned in a reasonable amount of time | 49960 | 4.35 | 1.00 | 5.00 |
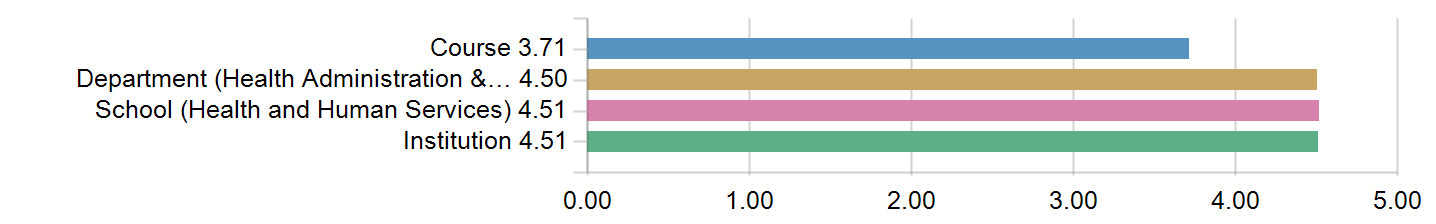
| The instructor covered the important aspects of the course as outlined in the syllabus | 51262 | 4.51 | 1.00 | 5.00 |
| The instructor made the class intellectually stimulating | 51044 | 4.24 | 1.00 | 5.00 |
| The instructor encouraged the students to be actively involved in the material through discussion, assignments, and other activities | 50640 | 4.40 | 1.00 | 5.00 |
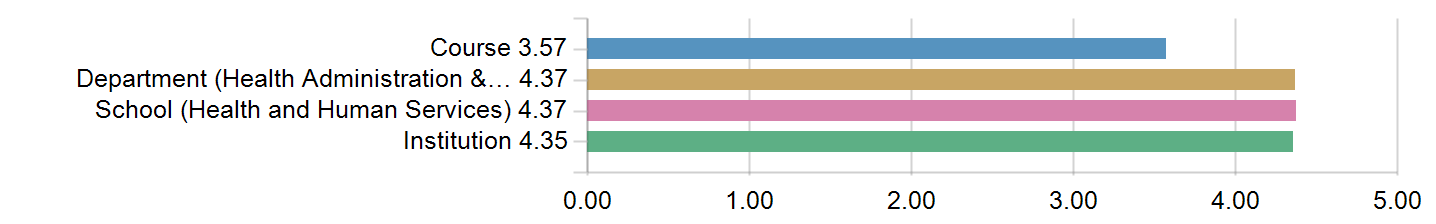
| My overall rating of the teaching | 51640 | 4.35 | 1.00 | 5.00 |
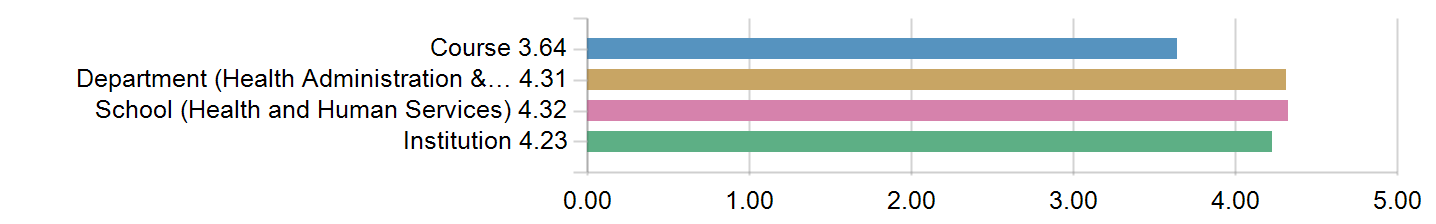
| My overall rating of this course | 51694 | 4.23 | 1.00 | 5.00 |
Student Evaluations of Teaching (Q1-Q16) - Chart
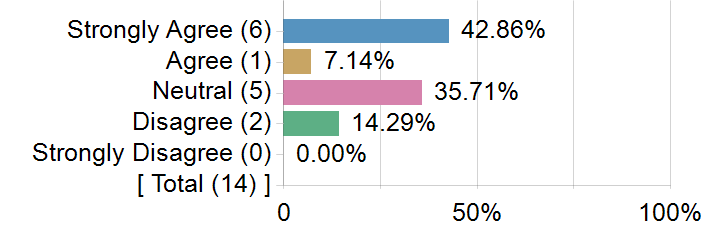
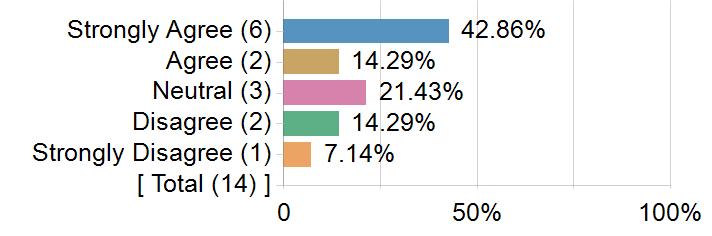
1. Course requirements and expectations were clear
2. The course was well organized

3. The instructor helped me to better understand the course material
4. Feedback (written comments and suggestions on papers, solutions provided, class discussion, etc.) was helpful
5. The instructor showed respect for the students
6. The instructor was accessible either in person or electronically
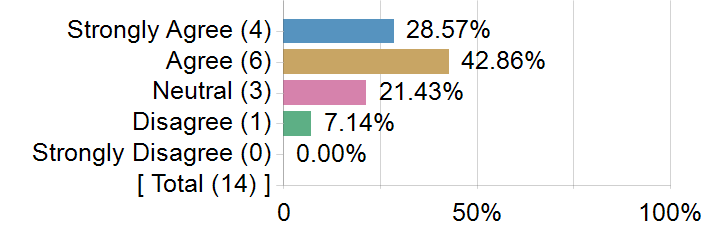
7. The course grading policy was clear
8. Graded work reflected what was covered in the course
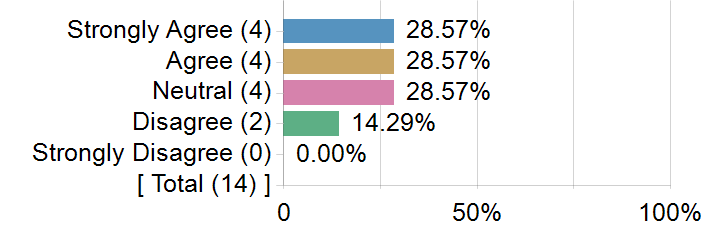
9. The assignments (projects, papers, presentations, etc.) helped me learn the material
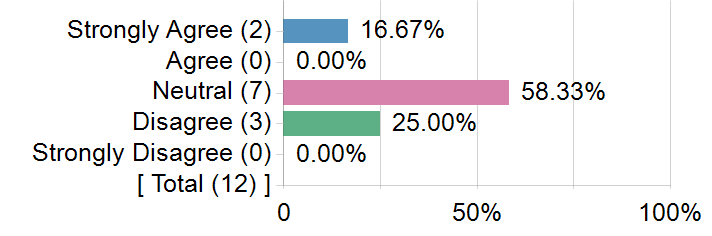
10. The textbook and/or assigned readings helped me understand the material
11. Assignments and exams were returned in a reasonable amount of time
12. The instructor covered the important aspects of the course as outlined in the syllabus
13. The instructor made the class intellectually stimulating

14. The instructor encouraged the students to be actively involved in the material through discussion, assignments, and other activities

15. My overall rating of the teaching
16. My overall rating of this course
Student Evaluations of Teaching (Q1-Q16)
| Mean | Median | Min | Max | 25th Percentile | 50th Percentile | 75th Percentile | Resp | ||
|---|---|---|---|---|---|---|---|---|---|
| Course requirements and expectations were clear | 3.43 | 3.50 | 2.00 | 5.00 | 2.75 | 3.50 | 4.00 | 14 | |
| The course was well organized | 3.14 | 3.00 | 1.00 | 5.00 | 2.00 | 3.00 | 4.25 | 14 | |
| The instructor helped me to better understand the course material | 3.14 | 3.00 | 2.00 | 5.00 | 2.00 | 3.00 | 4.25 | 14 | |
| Feedback (written comments and suggestions on papers, solutions provided, class discussion, etc.) was helpful | 3.46 | 3.00 | 2.00 | 5.00 | 3.00 | 3.00 | 4.50 | 13 | |
| The instructor showed respect for the students | 4.71 | 5.00 | 4.00 | 5.00 | 4.00 | 5.00 | 5.00 | 14 | |
| The instructor was accessible either in person or electronically | 4.43 | 5.00 | 3.00 | 5.00 | 4.00 | 5.00 | 5.00 | 14 | |
| The course grading policy was clear | 4.00 | 4.00 | 2.00 | 5.00 | 3.00 | 4.00 | 5.00 | 14 | |
| Graded work reflected what was covered in the course | 4.07 | 4.00 | 2.00 | 5.00 | 3.00 | 4.00 | 5.00 | 14 | |
| The assignments (projects, papers, presentations, etc.) helped me learn the material | 3.79 | 3.50 | 2.00 | 5.00 | 3.00 | 3.50 | 5.00 | 14 | |
| The textbook and/or assigned readings helped me understand the material | 3.08 | 3.00 | 2.00 | 5.00 | 2.25 | 3.00 | 3.00 | 12 | |
| Assignments and exams were returned in a reasonable amount of time | 3.93 | 4.00 | 2.00 | 5.00 | 3.00 | 4.00 | 5.00 | 14 | |
| The instructor covered the important aspects of the course as outlined in the syllabus | 3.71 | 4.00 | 2.00 | 5.00 | 3.00 | 4.00 | 5.00 | 14 | |
| The instructor made the class intellectually stimulating | 3.71 | 4.00 | 1.00 | 5.00 | 2.75 | 4.00 | 5.00 | 14 | |
| The instructor encouraged the students to be actively involved in the material through discussion, assignments, and other activities | 4.31 | 5.00 | 3.00 | 5.00 | 3.50 | 5.00 | 5.00 | 13 | |
| My overall rating of the teaching | 3.57 | 4.00 | 2.00 | 5.00 | 2.75 | 4.00 | 4.25 | 14 | |
| My overall rating of this course | 3.64 | 4.00 | 2.00 | 5.00 | 3.00 | 4.00 | 4.00 | 14 |
Student Evaluations of Teaching (Q1-Q16)
| Competency Statistics | Value |
|---|---|
| Mean | 3.76 |
| Median | 4.00 |
1. Course requirements and expectations were clear
| Statistics | Value |
|---|---|
| Response Count | 14 |
| Mean | 3.43 |
| Median | 3.50 |
2. The course was well organized
| Statistics | Value |
|---|---|
| Response Count | 14 |
| Mean | 3.14 |
| Median | 3.00 |
3. The instructor helped me to better understand the course material
| Statistics | Value |
|---|---|
| Response Count | 14 |
| Mean | 3.14 |
| Median | 3.00 |
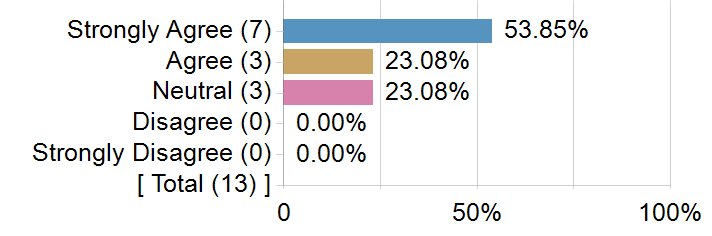
4. Feedback (written comments and suggestions on papers, solutions provided, class discussion, etc.) was helpful
| Statistics | Value |
|---|---|
| Response Count | 13 |
| Mean | 3.46 |
| Median | 3.00 |
5. The instructor showed respect for the students
| Statistics | Value |
|---|---|
| Response Count | 14 |
| Mean | 4.71 |
| Median | 5.00 |
6. The instructor was accessible either in person or electronically
| Statistics | Value |
|---|---|
| Response Count | 14 |
| Mean | 4.43 |
| Median | 5.00 |
7. The course grading policy was clear
| Statistics | Value |
|---|---|
| Response Count | 14 |
| Mean | 4.00 |
| Median | 4.00 |
8. Graded work reflected what was covered in the course
| Statistics | Value |
|---|---|
| Response Count | 14 |
| Mean | 4.07 |
| Median | 4.00 |
9. The assignments (projects, papers, presentations, etc.) helped me learn the material
| Statistics | Value |
|---|---|
| Response Count | 14 |
| Mean | 3.79 |
| Median | 3.50 |
10. The textbook and/or assigned readings helped me understand the material
| Statistics | Value |
|---|---|
| Response Count | 12 |
| Mean | 3.08 |
| Median | 3.00 |
11. Assignments and exams were returned in a reasonable amount of time
| Statistics | Value |
|---|---|
| Response Count | 14 |
| Mean | 3.93 |
| Median | 4.00 |
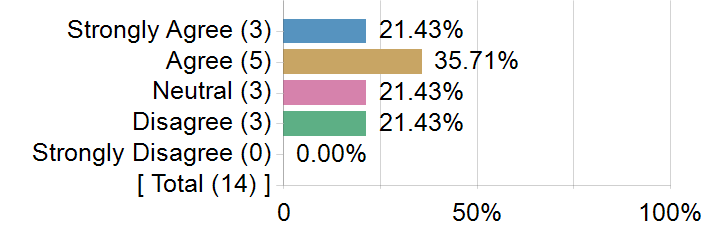
12. The instructor covered the important aspects of the course as outlined in the syllabus
| Statistics | Value |
|---|---|
| Response Count | 14 |
| Mean | 3.71 |
| Median | 4.00 |
13. The instructor made the class intellectually stimulating
| Statistics | Value |
|---|---|
| Response Count | 14 |
| Mean | 3.71 |
| Median | 4.00 |
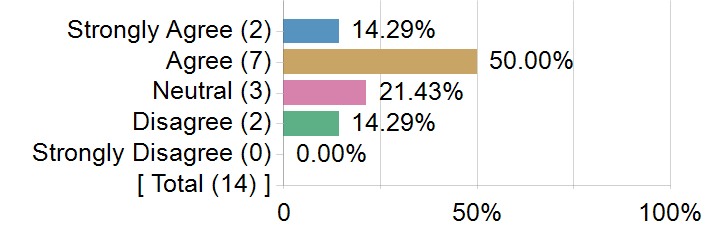
14. The instructor encouraged the students to be actively involved in the material through discussion, assignments, and other activities
| Statistics | Value |
|---|---|
| Response Count | 13 |
| Mean | 4.31 |
| Median | 5.00 |
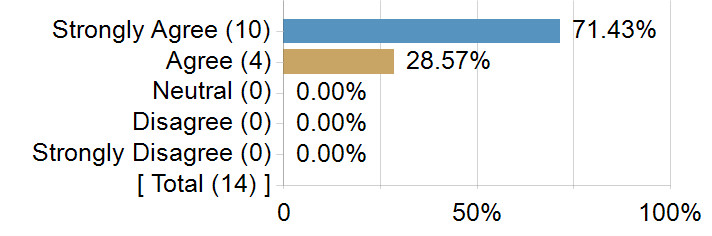
15. My overall rating of the teaching
| Statistics | Value |
|---|---|
| Response Count | 14 |
| Mean | 3.57 |
| Median | 4.00 |
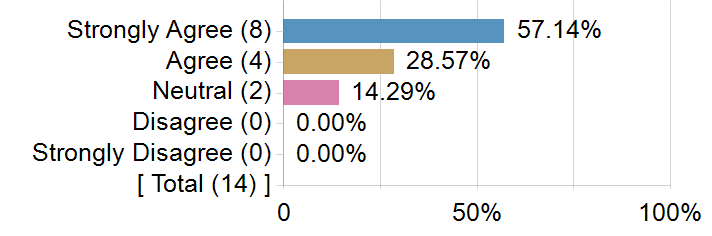
16. My overall rating of this course
| Statistics | Value |
|---|---|
| Response Count | 14 |
| Mean | 3.64 |
| Median | 4.00 |
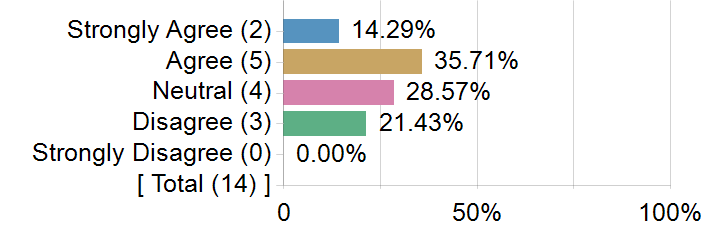
The amount of effort you put into the course
The amount of effort you put into the course
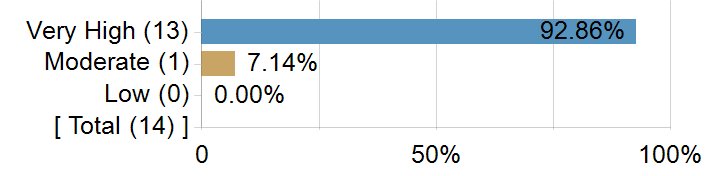
| Statistics | Value |
|---|---|
| Response Count | 14 |
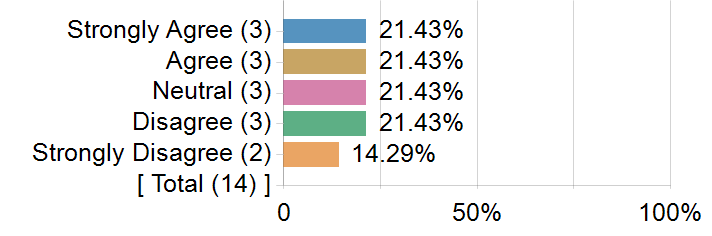
The number of times you were absent from class
The number of times you were absent from class
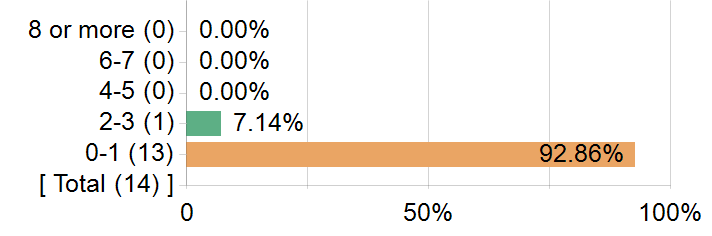
| Statistics | Value |
|---|---|
| Response Count | 14 |
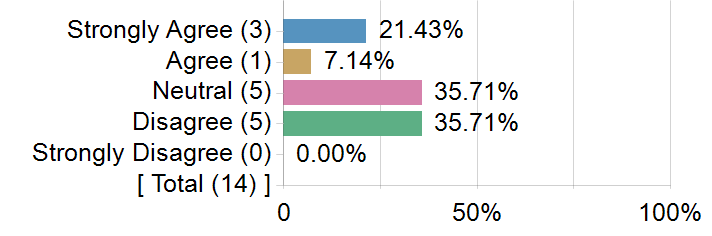
The grade you expect in this class
The grade you expect in this class
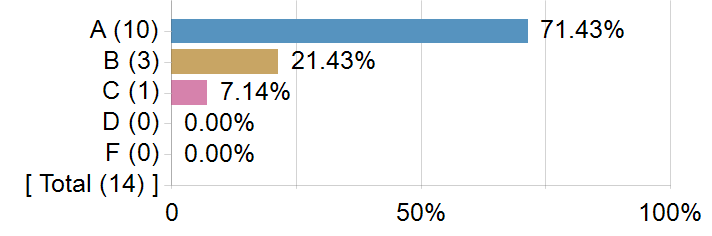
| Statistics | Value |
|---|---|
| Response Count | 14 |
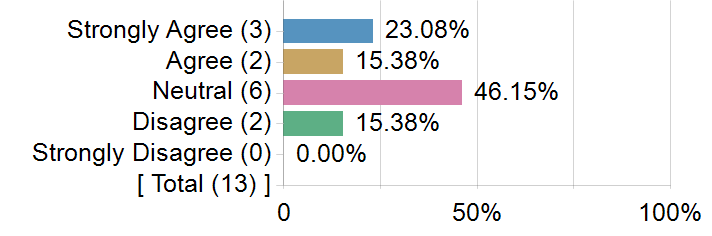
This course is:
This course is:
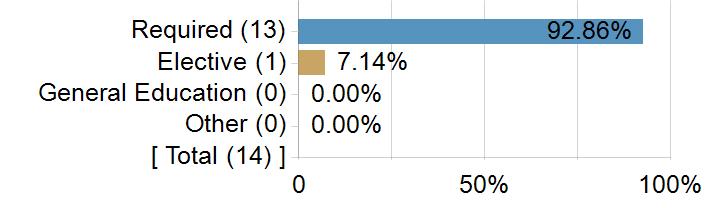
| Statistics | Value |
|---|---|
| Response Count | 14 |
What aspects of the course and the way it was taught helped you to learn?
| Comments |
|---|
| I liked the group aspect of this class and how homework was done during class. Lectures were very little and it was heavy project based making the learning experience interesting. |
| Nothing |
| work with classmates and help each others. |
| Professor Alemi wanted his students to teach and help eachother rather than having him give three hours lecture and leaving us alone to do the assingments. The involvement of all classmates to help eachtother and making connections with people that had similar problems helped me learn this course better than any other. |
| doing assignments on our own and having our class fellows help us |
| The teach ones really helped me learn and walk through the processes. |
| If the professor taught more instead of students teaching themselves |
| Teach ones for each assignment and collaboration was very helpful. |
What modifications do you suggest for the next time the course is taught?
| Comments |
|---|
| I want tutorials specifically from the professor after assignments were turned in to clear questions. |
| The course has to be taught with the instructor. This isn't the type of course that we just learn on our own. |
| I wish that professor explains more about codes and why need to use them. |
| Professor Alemi should have more detailed insturctions on what students should be doing specially for the exams. He should also give us correct answers after we have all finished the assignments, so that we know for sure its correct or wrong. |
| perfect class and great instructor |
| More explanation on the breakdown of codes would be helpful. |
| Less teach ones and more in class lectures with in class coding with the professor doing the code and explaining it as he does it. Doing teach ones for some of the concepts is a good idea, but for some of the more difficult ones, it can be very hard to understand and learn it while having to worry about doing a teach one. In class coding with the professor doing it would help ease that worry and focus more on learning and understanding the code itself and can ask questions as the code is typed out. |
| More help from the professor |
| I think having an answer key for assignments and exams would be a lot more helpful. I feel like I wasted a lot of time trying to fix my answers after I was told the answers were correct. |
| I wish there was an answer key for each assignment provided by the Professor so students don't get confused on what the correct "answer" is. Also, more detailed instructions on the midterm and final exams would have been helpful. |
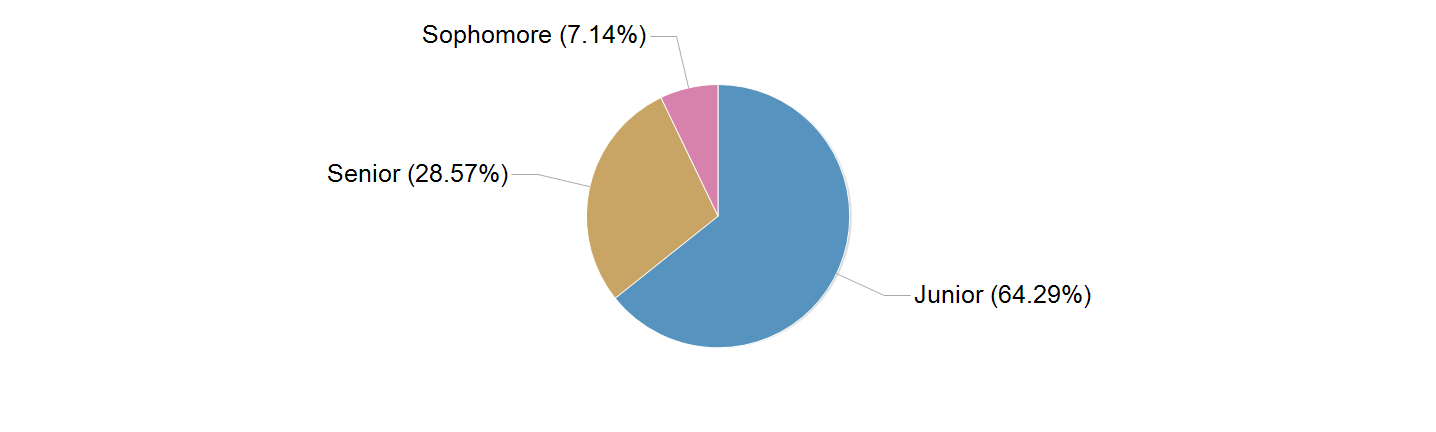
Student Class
Student College

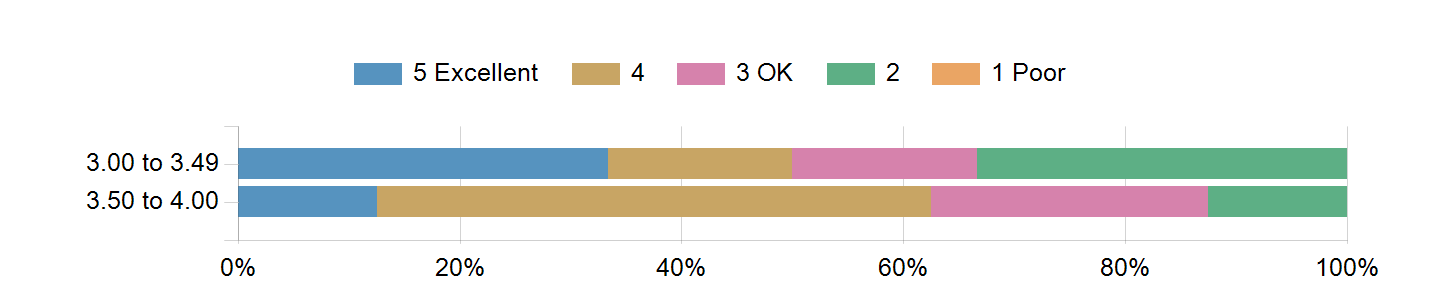
My overall rating of the teaching - Vs. GPA
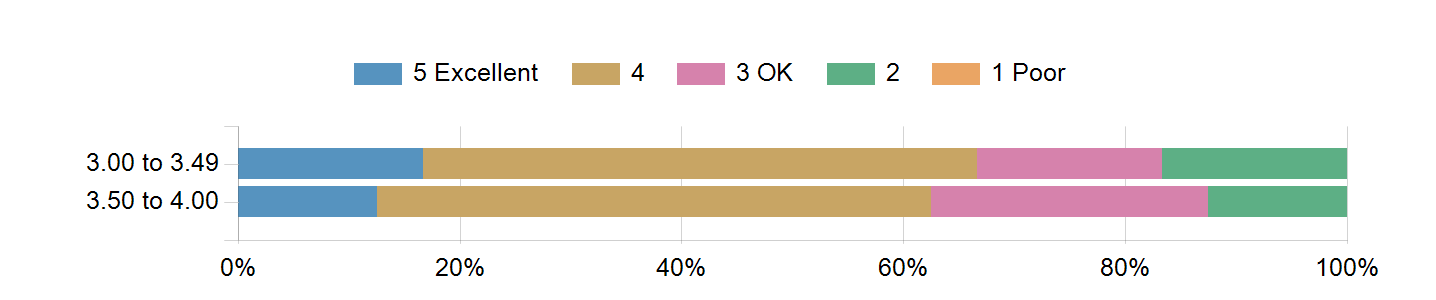
My overall rating of this course Vs. GPA
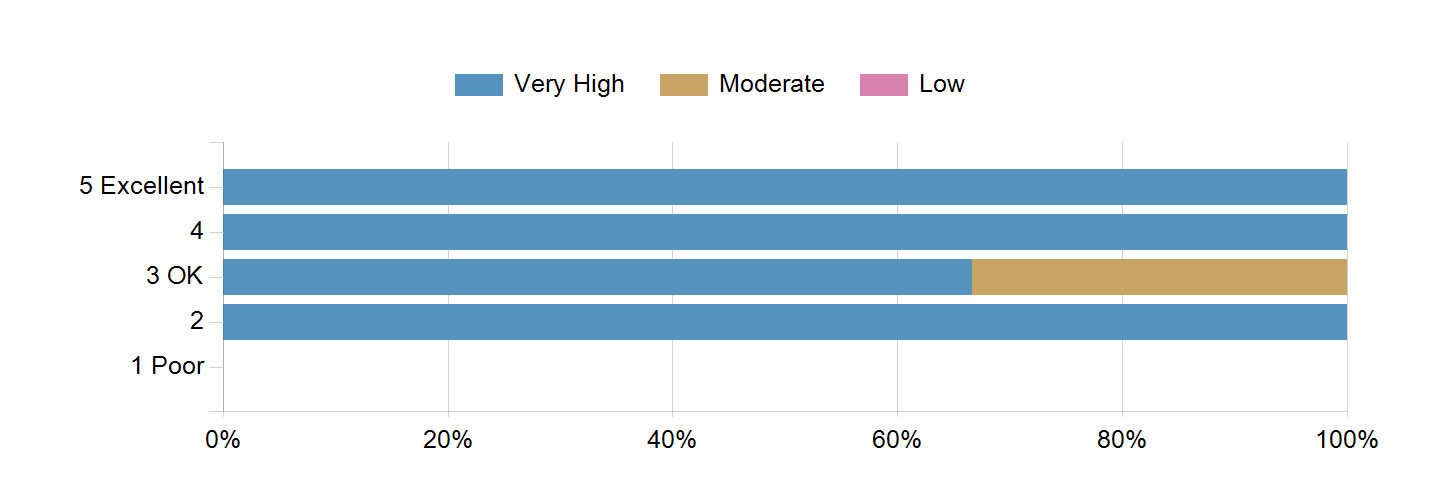
The amount of effort you put into the course Vs. My overall rating of the teaching

The amount of effort you put into the course Vs. My overall rating of this course
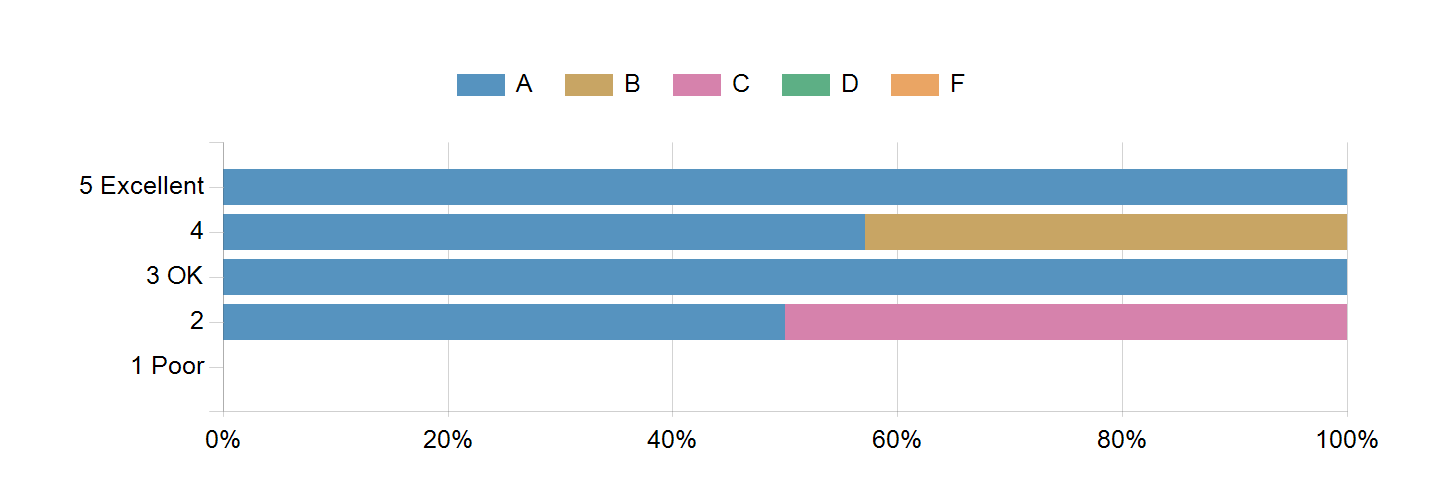
The grade you expect in this class Vs. My overall rating of the teaching
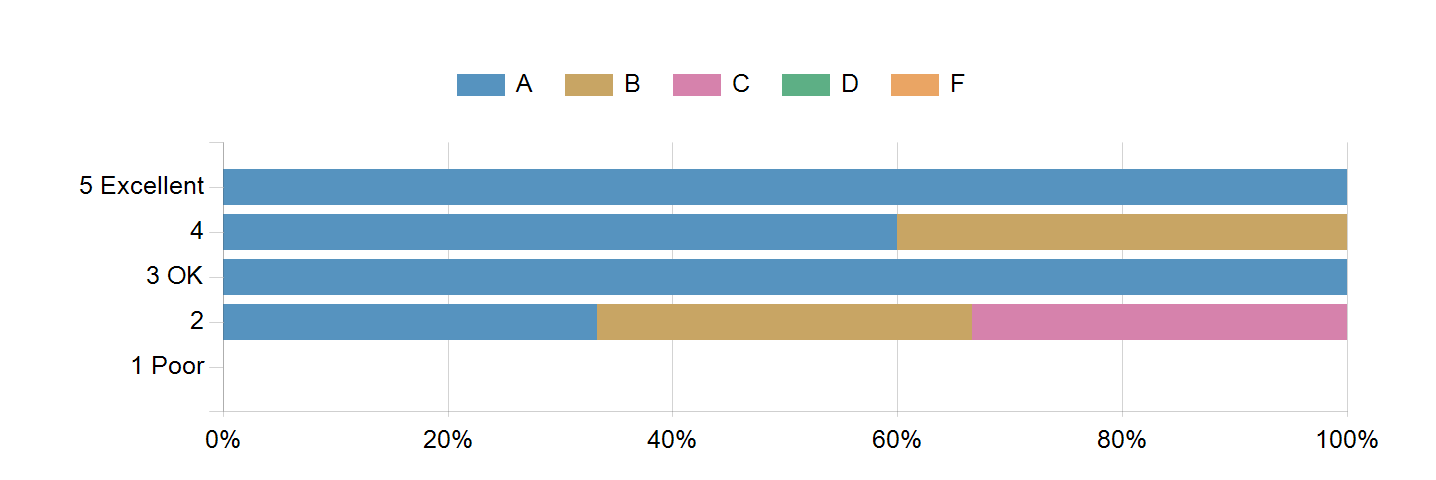
The grade you expect in this class Vs. My overall rating of this course
This course is: Vs. My overall rating of the teaching
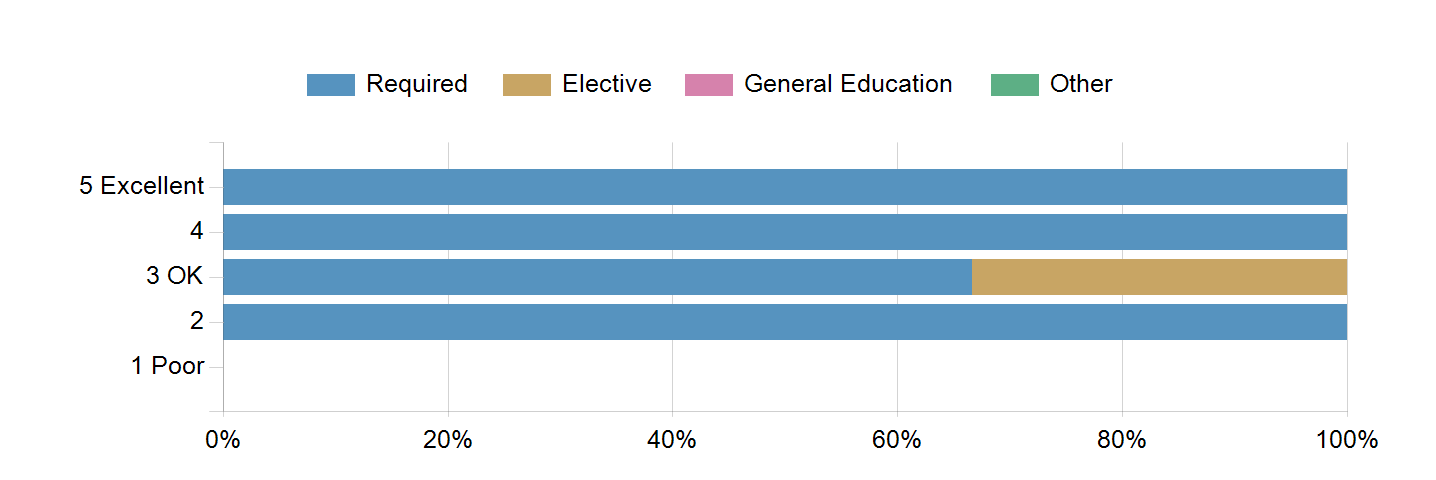
This course is: Vs. My overall rating of this course
