|
|
||||||||||||||||||||||||||||||||||||||||||||||||||||||||||||||||||||||||||||||||||||||||||||||||||||||||||||||||||||||||||||||||||||||||||||||||||||||||||||||||||||||||||||||||||||||||||||||||||||
 |
||||||||||||||||||||||||||||||||||||||||||||||||||||||||||||||||||||||||||||||||||||||||||||||||||||||||||||||||||||||||||||||||||||||||||||||||||||||||||||||||||||||||||||||||||||||||||||||||||||
Objective Risk Analysis Can Reduce
|
||||||||||||||||||||||||||||||||||||||||||||||||||||||||||||||||||||||||||||||||||||||||||||||||||||||||||||||||||||||||||||||||||||||||||||||||||||||||||||||||||||||||||||||||||||||||||||||||||||
|
n |
is the number of hazards. |
|
Ri |
is the risk factor "i". |
|
p(U| R1, …, Rn ) |
is the probability of unauthorized disclosures given various risks factors (vulnerabilities) in the organization. |
|
p(U | Ri ) |
is the conditional probability of unauthorized disclosure given the presence of a risk factor in the organization. This variable is calculated using the Bayes formula presented below. |
|
p(Ri) |
is the prevalence of the risk factor in the organization. This variable is calculated from time-to-occurrence of the hazard within the health care organization (see below). |
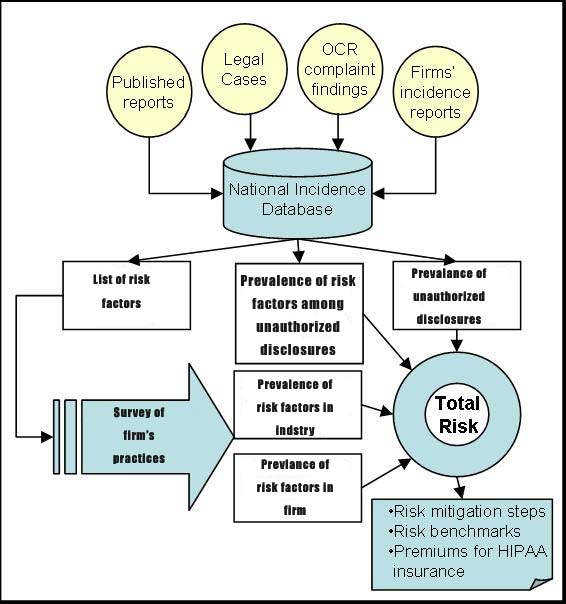
This formula is known as the law of total probability and it states that the probability of an unauthorized disclosure is the sum of all ways in which an unauthorized disclosure can happen from different risk factors within the organization.
We estimate the frequency of risk factors within an organization, p(Ri), by surveying key informants within the organization. Since privacy risk factors can be rare, we assess the probability of their presence from the average time between reported occurrences of the risk factor:[1]
p(Ri) = 1 / (1+ ti)
Where,
|
ti |
is the average time between the reoccurrence of risk factor “i”. These dates are available through survey of health care organizations. |
|
p(Ri) |
is the daily probability of risk factor "i". |
Use of this formula assumes that the risk factor has a binomial distribution of occurring in which the probability of the risk factor is relatively rare but constant and independent from future occurrences. These assumptions may not be reasonable. For example, when organizations actively improve their security, then the assumption of constant probability is violated. If the assumptions of binomial distribution are met or are acceptable as a first approximation, then time-between presence of risk factor has a geometric distribution. In a geometric distribution, the relationship between time-between events and probability of the event are given as per above formula.
Some risk factors are so rare that they may not occur during the observation period. In these circumstances, then length of observation period can be used as a surrogate for time-between reoccurrences. This assumes that the risk factor would occur the day after the end of observation period and thus it provides an upper limit for the prevalence of the risk factor.
For an example of the use of the formula consider if we were to asses the prevalence of “physical theft of a computer.” Suppose that our records show that such theft occurs once every three months, then the time between two thefts is 90 days and the probability of a theft for any day is calculated as:
p( Physical theft of a computer) = 1 /(1+91) = 0.01
This method of calculating prevalence of hazards stands in contrast to the arbitrary classification of risks by others. For example, the International Organization for Standardization (ISO) on December 2000 ratified the standard 17799 for management of information security. The authors of this standard proposed to measure risk using the scale in Table 1. Table 1 also reports our approach to quantification of same scale. Clearly, the ISO 17799 standard does not accurately reflect the probability of the reported events. In fact, the correlation between ISO 17799 rating and calculated probabilities is 0.69, showing a moderate relationship between the two estimates.
|
ISO 17799 word assignment |
Frequency of event |
Rating by ISO 17799 |
Calculated probability |
|
Negligible |
Unlikely to occur* |
0 |
0.0003 |
|
Very low |
2-3 times every 5 years |
1 |
0.0014 |
|
Low |
<= once per year |
2 |
0.0027 |
|
Medium |
<= once per 6 months |
3 |
0.0056 |
|
High |
<= once per month |
4 |
0.0333 |
|
Very high |
=> once per month** |
5 |
0.1429 |
|
Extreme |
=> one per day |
6 |
1 |
|
Table 1: Calculated Probabilities for ISO terms |
|||
|
* Assumes less than once per 10 years ** Assumes once per week |
|||
We use the Bayes theorem to calculate the probability of unauthorized
disclosure after the occurrence of a risk factor:
p(U | Ri) = p(Ri | U) p(U) / p(Ri)
Where:
|
p(Ri) |
is the probability of observing risk “I”. This is obtained from survey of health care organizations using time-to-occurrence of the risk factor. |
|
p(U) |
is the probability of unauthorized disclosure across institutions. These data are calculated from National Incidence Database of Unauthorized Disclosures. |
|
p(Hi | U) |
shows the prevalence of risk factor “i” among unauthorized disclosures. These data are available through National Incidence Database on Unauthorized Disclosures. |
For example, if probability of unauthorized disclosure across organizations is 0.5% and the probability of observing computer theft is 1%, and the proportion of unauthorized disclosures attributed to computer theft is 2%, then the conditional probability of unauthorized disclosure following computer theft is 0.02*0.05/0.01 = 0.10 .
Results
In the absence of the National Incidence Database of Unauthorized Disclosures, we could rely on publicly reported privacy violations to show how our proposed method will work. We identified publicly available reports of unauthorized disclosures from (1) review of complaints to Department of Health and Human Services regarding privacy issues, (2) Legal and news databases for reports of unauthorized disclosures. Table 2 shows the term used to search for unauthorized disclosures and the number of unique cases found:
|
Terms searched |
Databases Searched |
Records found |
Number of unauthorized disclosures |
Dates |
Probability of unauthorized disclosure |
|
Patient Confidentiality [Keyword] OR Confidential Medical Records [Keyword] OR Privacy [Keyword] medical records [additional terms] OR Privacy [Keyword] Medical Records [additional terms] unauthorized disclosure [focus] |
LexisNexis Academic |
47 |
2 |
01/01/03 -12/31/03 |
.005 |
|
Privacy of [Subject] Cases [Subdivision] OR Medical Records [Subject] Cases [Subdivision] OR Medical Records [Subject] Laws, Regulations and Rules [Subdivision] OR Hospital Information Systems [Subject] Safety and Security Measures [Subdivision]* |
Health Reference Center-Academic Infotrac |
141 |
8 |
01/01/90 -12/31/03 |
.022 |
|
US Dept of Health & Human Services HIPAA complaints |
DHHS reports |
22 |
16 |
01/01/03-12/31/03 |
.044 |
|
Direct reports |
|
3 |
3 |
01/01/03-12/31/03 |
.008 |
|
Total: p(U) |
|
213 |
29 |
01/01/90-12/31/03 |
.079 |
|
Table 2: Frequency of Publicly Reported Incidences of Unauthorized Disclosures |
|||||
|
*Also Includes: OR Business & Health, Feb 2001 v19 i2 p21 (Journal) OR Report on Patient Privacy, Oct 2003 v3 i10 p12 (Journal) OR Report on Patient Privacy, July 2003 v3 i7 p8 (Journal) OR Report on Patient Privacy, June 2003 v3 i6 p6 (Journal OR Report on Patient Privacy, Oct 2003 v3 i10 p12 (Journal) OR Computerworld, Dec 18, 200 p7 (Journal) OR InformationWeek, Dec 31, 2002 pNA (Journal) OR Modern Healthcare, Sept 15, 2003 v33 i37 p18 (Journal) OR Modern Physician, Nov 1, 2003 v7 i11 p2 (Journal) OR American Druggist, Jan 1999 v216 i1 p62(2) (Journal) OR AIDS Weekly, August 24, 1992 p16(2) (Journal) |
|||||
For each case of unauthorized disclosure in our database, we described a risk factor that organizations could have reduced through security controls. A comprehensive list of experienced hazards we identified through review of publicly available reports of unauthorized disclosure is available in Table 3. Obviously, security professionals may list many more vulnerabilities but these may not have yet occurred anywhere.
We estimated the probability of an unauthorized disclosure by examining the frequency of reports of unauthorized disclosures in legal, news and complaint databases. These frequencies respectively were: 0.009, 0.006 and 0.003 per day. The overall probability of unauthorized disclosure across all sources was 0.019. Figure 2 shows the change in reported rates of unauthorized disclosures over the last decade. There is a significant increase in the rates in 2003, when DHHS started collecting complaints.
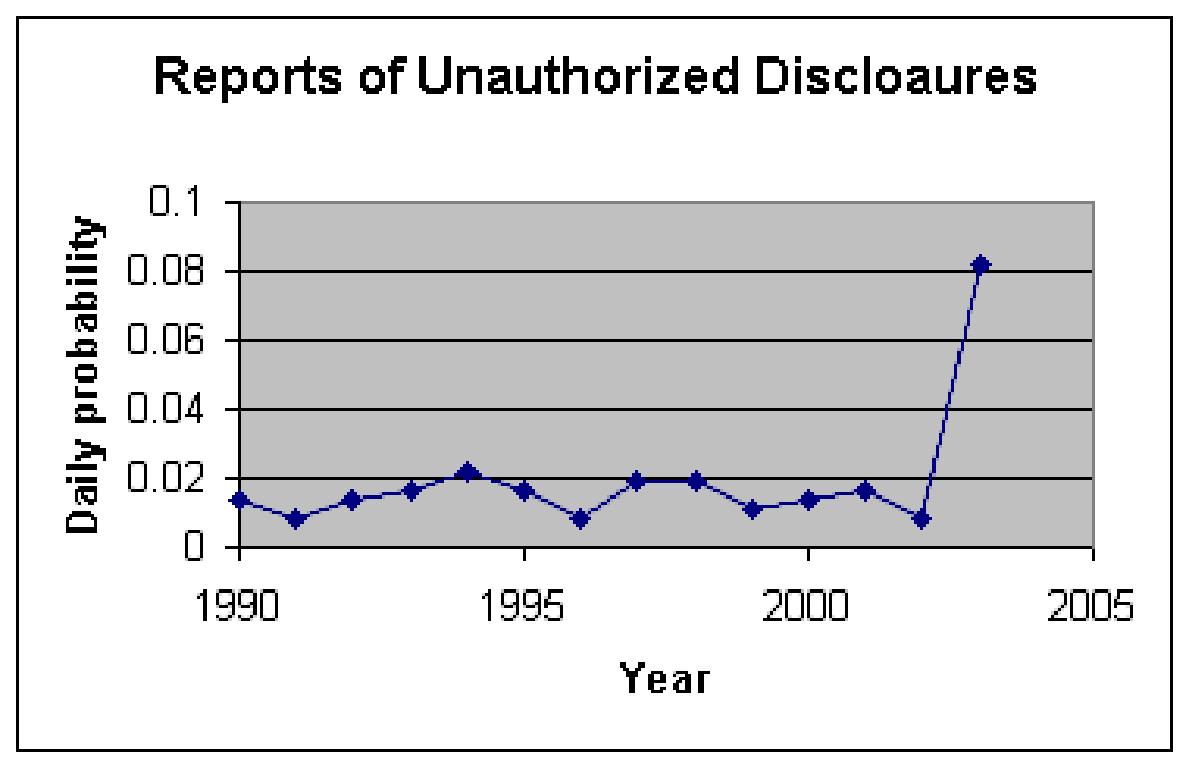
Figure 2: Rate of Publicly Reported Unauthorized Disclosures
Over Time
Our analysis of the reported privacy violations identified the risk factors in Table 3. What surprised us about this set of risk factors is its length. It is radically shorter than what a typical list of factors might look like. Certainly other factors have been suggested but our review of observed unauthorized disclosures limited the list to items in Table 3. It is possible, and perhaps likely, that we are not aware of all cases in which unauthorized disclosures have occurred. Therefore our list of factors might be incomplete. It is also possible that other experts reviewing the same cases may arrive at slightly different set of risk factors. But the real point is that no matter who sets the risk factors and how many cases are reviewed, the number of risk factors will be relatively small because many risks can be imagined while few actually occur. Because relying on case histories reduces the number of risk factors, it radically reduces the time it takes to conduct risk analysis.
Using the risk factors in Table 3, we surveyed
3
organizations.
Table 3 shows the estimated frequency of risk factors in one of the
surveyed organizations compared to remaining peer organizations.
Organizations can use the information to set priorities on which
security problem they should address first. Table 3 shows risk
factors in which the organization is performing worse than the average
of its peers. This type of benchmarked information is important in
helping organizations think through industry security and privacy
standards.
|
Description of risk factor |
Prevalence of risk factor in
the organization |
Prevalence of
security violation
given the risk factor |
|
|
Employee views
paper documents or manipulates computer passwords to view
records of patients not under his/her care |
0.0003 |
1 |
|
|
Benefit
Organizations or employers request employee information |
0.0003 |
0.8805 |
|
|
Employees engaged
in whistle blowing to uncover illegal or unacceptable business
or clinical practices |
0.0003 |
0.0201 |
|
|
Clinician using
unsecured email environment |
0.0003 |
0.1606 |
|
|
Employee removes
patient records from secure location or workplace without
authorization |
0.0003 |
0.88 |
|
|
External infection
of computers/password/network Systems (e.g. computer hacker) |
0.0003 |
0.5888 |
|
|
Theft of computers
or hard drives |
0.0003 |
0.5867 |
|
|
|
0.0003 |
1 |
|
|
Blackmail/Extortion
of organization or an employee |
0.0003 |
1 |
|
|
Changes in custody
or family relationships not revealed by the patient |
0.0003 |
0.1472 |
|
|
Audit of business
practices by outside firm without clinicians’ approval |
0.0003 |
0.4416 |
|
|
Business Associate
violates Chain of Trust Agreement |
0.0003 |
1 |
|
|
Error in patient
identity during data transfer to third party insurers |
0.0014 |
0.0142 |
|
|
Caring for
employees’ friends and family members and discussing the care
outside of the work environment |
0.0014 |
0.2202 |
|
|
Clinician gathers
information from patients’ family and friends after the visit
without the patient’s consent |
0.0014 |
1 |
|
|
Patient using
identity of another person to gain insurance benefits |
0.0056 |
0.093 |
|
|
Patient records
(paper documents) not kept in secure environment or sealed |
0.0056 |
0.0592 |
|
|
Discussion of
patient care with co-workers not engaged in care |
0.0056 |
0.1218 |
|
|
Medical reports or
records with wrong recipient information |
0.1429 |
0.0405 |
|
|
Patient care
discussed in a setting where others can easily hear |
0.1429 |
0.0023 |
|
| Table 3: Predicting Probability of Violations from Prevalence of Vulnerabilities | |||
Based on the risk factors present in the organization, an analyst can
calculate the probability of unauthorized disclosure for the
organization. Table 3 shows both the prevalence of the risk
factors within the organization and the relationship between the risk
factors and unauthorized disclosure (estimated from NIDUD).
Health care organizations, regulators and health insurers can use this
information to categorize the organization’s total risk category.
Discussion
This paper proposes a method for assessing risk of unauthorized disclosure within a health care organization. It shows a mathematical formula for how to combine data on prevalence of hazards at health care enterprises with conditional probabilities estimated from the database of unauthorized disclosures. The advantages of the proposed approach are:
-
It is not based on speculations regarding potential risks but on actual experienced incidences within the enterprise and across the industry.
-
Probability of rare events are estimated from time-between-events which allows estimation of objective probabilities for events that occur once or twice.
-
It provides a consistent quantitative estimate of risk. Our estimated probabilities may not be accurate to the last digit but they provide consistent processing of the information and thus the estimated risk can be compared to other institutions' risk factors and organizations can benchmark themselves against their peer.
-
If repeated overtime, it measures the organizations' progress in reducing risk of privacy violations.
-
It can be used to set premiums for HIPAA insurance, which can create a market incentive for more private healthcare transactions
For this approach to risk assessment to work, we need a centralized database of incidences of unauthorized disclosures. We did not have access to such a database but showed that the information can be assembled from public records of court proceedings, news reports, and complaints to Department of Health.
Are the procedures described practical? The data needed at the enterprise level is minimal. Most organizations have a data set of security incidence categorized by type of hazard and catalogued by date of occurrence. The creation of the cumulative national incidence database is more difficult. While we succeeded in creating it from public records, a more reasonable approach is to ask institutions to report these data to a central location, perhaps to the Joint Commission for Accreditation of Health Care Organization. The database calls for collaboration among health care institutions that may currently compete and perhaps may be concerned with the security of the data they share. We believe safeguards could be put in place that would protect individual institution’s identity. The benefit of such database outweighs its potential problems. In the absence of incidence database, risk analysis for HIPAA will not be consistent across organizations and may involve considerable effort and speculation about events that have not occurred or do not matter. Many organizations may not even conduct quantitative risk analysis and may settle for vague and arbitrary qualitative measure of low, medium and high risk. The incidence database can pool information from a large number of organizations so that it has sufficient cases to estimate various probabilities. The HIPAA legislation and final HIPAA rules already require organizations to maintain logs of every disclosure. The incidence database centralizes this information and allows the organization to use the information in a collaborative fashion to conduct its risk analysis. In the process of these collaborations, organizations learn about best practices.
Presentations
- Listen to Objective Privacy Risk Analysis
- Please download slides for this lecture. An alternative set of slides is also available.
Questionnaire
A complete survey of privacy hazards can be downloaded by clicking here.
What Do You Know?
This section is under development.
More
- Read about assessment of rare probabilities at http://gunston.gmu.edu/healthscience/730/ProbabilityRareEvent.asp
- The Geneva Papers on Risk and Insurance Theory (Kluwer)
- The Journal of Risk and Insurance Online
- Journal of Risk and Uncertainty (Kluwer)
- Risk (the official journal of the Risk Assessment & Policy Association)
- Risk Management Magazine
- An example of risk analysis using probability tree analysis.
References
[1] Centers for Medicare & Medicaid Services (CSM), HHS. Health insurance reform: security standards. Final rule. Fed Regist. 2003 Feb 20;68(34):8334-81.
[2] Bedford T, Cooke R. Probabilitistic risk analysis: Foundations and methods. Cambridge University Press, Cambridge United Kingdom, 2001, 4-9.
[3] Colglazier EW, Weatherwas RK. Failure estimates for the space shuttle. Abstracts of the Society for Risk Analysis Annual Meeting 1986 Boston MA, p 80, Nov 9-12, 1986
[4] Keeney J et al. Report of the President’s Commission on the Accident at Three Mile Island, Washington DC 1979.
This page is part of the course on Decision Analysis, the lecture on Risk Analysis. This presentation was based on Alemi F, Shahriar B, Shriver J, Arya V. Probabilistic Risk Analysis (in review) . For assistance write to Farrokh Alemi, Ph.D. Most recent revision 03/28/2018. This work has been supported by grant from Critical Infrastructure Protection project. This paper reflects the opinions of the authors and not necessarily the policies and practices of their organizations.