|
|
 |
|||||||||||||||||||||||||||||||||||||||||||||||||||||||||||||
Probabilistic Root Cause AnalysisBy Farrokh Alemi, Ph.D. |
|||||||||||||||||||||||||||||||||||||||||||||||||||||||||||||
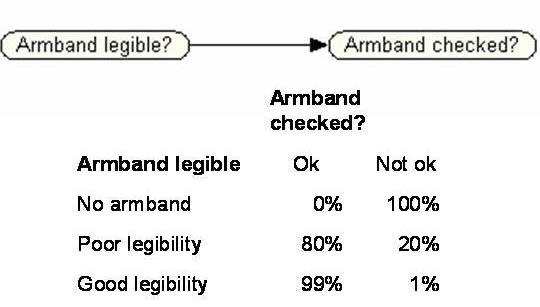
SummaryRoot Cause and Failure Mode Analyses are commonly performed in hospitals to understand factors that contribute to errors and mistakes. Despite the effort that healthcare professionals are putting into creating these analyses, few models of root causes are validated or used to predict future occurrences of adverse events. We review the literature on Causal Networks and Bayesian Probability models and show how these tools can be used to improve Root Cause Analysis. In particular, we show that more in-depth insight can be gained by (1) testing the proposed root causes for structural assumptions of independence (root causes should be conditionally independent of sentinel events given direct causes) and by verifying that the root cause model implies probabilities that are comparable to those reported in the literature or known through experience of the health care organization. We show how both assumptions and conclusions of Root Cause Analysis can be verified against observed data. IntroductionRoot Cause Analysis, according to the Joint Commission on Accreditation of Health Care Organizations is a "process for identifying the basic or causal factors that underlie variation in performance, including the occurrence or possible occurrence of a sentinel event." Sentinel events include medication errors, patients' suicide, procedure complications, wrong site surgery, treatment delay, restraint death, elopement death, assault or rape, transfusion death, and infant abduction. Direct causes bring about the sentinel event without any other intervening event. Most direct causes are physically proximate to the sentinel event. The effect of root causes on sentinel events are always through some direct cause. Because of accreditation requirements and due to renewed interest in patient safety, many hospitals and clinics are actively conducting Root Cause Analyses. When a sentinel event occurs, most employees are focused on the direct causes that have led to the event. For example, many will claim that the cause of medication error is a failure to check label against the patient's armband. But this is just the direct cause. To get to the real reasons, one should ask why did the clinician not check the label against the armband. The purpose of Root Cause analysis is to go beyond direct and somewhat apparent causes and figure out the underlying reasons for the event. The objective is to force one to think harder about the source of the problem. It is possible that the label was not checked against the armband because the label was missing. Furthermore it is also possible that the label was missing because the computer was not printing. Then, the root cause is computer malfunction and the direct cause is the failure to check the label against the armband. Exhorting employees to check the armband against the label is a waste of time, if there is no label to check in the first place. A focus on direct causes may prevent the sentinel event for a while, but sooner or later the root cause will lead to a sentinel event. Inattention to root causes promotes palliative solutions that do not work in the long run. The value of root cause analysis lies in identifying the true, underlying causes. An investigation that dos not do this is at best a waste of time and resources, and at worst can exacerbate the problems it was intended to fix. But how do we know if our speculation about the causes of an event are correct? To make the situation worse, almost all who conduct Root Cause analyses become overconfident about the accuracy of their own insights. No matter how poorly an analysis is carried out, since there is no way of proving a person wrong, people persist in their own fallacies. Some are even incredulous about the possibility that their imagined causal influences could be wrong. They insist on the correctness of their insights because "it is obvious." Unfortunately, it is not clear why a complex problem, which has led to a sentinel event, which has not been corrected for years, which has been left unaddressed by hundreds of smart people should have such an obvious solution. After all, if the solution was so obvious why was it not adopted earlier? Search for obvious solutions contradicts the elusiveness of correcting for sentinel events. If a sound and reliable method existed for checking the accuracy and consistency of Root Cause Analysis, then employees might correct their misperceptions and not be so overconfident. One way to check on accuracy of Root Cause Analysis is to examine time to next sentinel event. Unfortunately, because sentinel events are rare, one has to wait a long time to see rare events occur again, even if no changes were made. Thus, the organization may have little solace by marking time as long periods of time are no sign of success and the event may reoccur any day. An alternative needs to be found to check the accuracy and consistency of Root Cause Analysis without having to wait for the next sentinel incidence. Simple methods for checking the accuracy of a Root Cause analysis have not been available to date. This paper suggests a method for doing so. As before, clinicians propose a set of causes. But now several additional steps are taken. First, probabilities are used to quantify the relationship between causes and effect. Then, the laws of probability and causal diagrams are examined to see if the suggested causes are consistent with the clinician's other beliefs and with existing objective data. Through a cycle of testing model assumptions and conclusions against observed data, one improves the accuracy of the analysis and gains new insights into the causes of the sentinel event. Bayesian NetworksWe use a set of techniques that have been developed for analysis of Bayesian Causal Networks to validate Root Cause Analysis. A Bayesian Causal Network is a mathematical model of the cause and effect relationships and the way these relationships lead to observed statistical patterns of an event. It consists of a set of nodes, typically pictured as ovals, connected by directed arcs. Each node represents a mutually exclusive and collectively exhaustive set of possible events. For example, Figure 1 shows a Bayesian network with two nodes. The node "Armband legibility?" has three possible values, exactly one of which must occur and no two can coincide. These states are "No armband," "Poor" and "Good." The other node "Armband checked?" has two possible values, "Ok" and "Not ok." A node with two possible values is called a binary node. Binary nodes are common in root cause analysis.
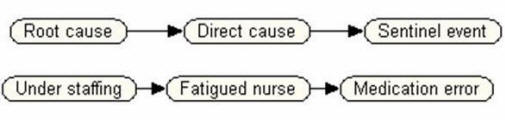
Figure 1: A simple Bayesian Causal Model with a Local Probability Table for "Armband checked?" A Bayesian Network is cyclical directed graph, meaning that you cannot start from a node and follow the arcs and arrive back to where you started. In a Bayesian Network, the relationship between any three nodes can be expressed in one of the following three ways: serial, diverging or converging structures. Each of these graph structures can be verified through tests of conditional independence and are further explained through examples below. The relationship between “Armband legible?” and “Armband Checked?” in Figure 1 is a direct causal relationship. Bayesian networks can also represent indirect causal relationships, through the concept of conditional independence, as shown in Figure 2. In this example, the root cause “Understaffing” is an indirect cause of the sentinel event. There is no direct arc from the root cause to the sentinel event. This means that the action of the root cause on the sentinel event is indirect, operating through an intermediate cause. That is, the direct cause of a medication error is a fatigued nurse. The root cause, “Understaffing,” is conditionally independent of the sentinel event given the intermediate cause. This means that if we intervene in any given instance to relieve a fatigued nurse, we can break the link from the root cause to the sentinel event, thus reducing the probability of the sentinel event to its nominal level. However, this solution is a palliative one and will not produce a long-term solution unless the root cause is addressed. Figure 2 illustrates a serial graph structure. In these structures the sentinel event is independent of the root cause given the known value for direct cause .
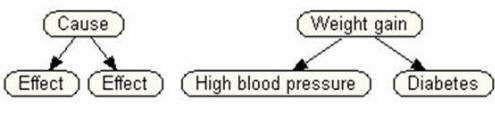
Figure 2: Serial Example of Direct and Root Cause of Medication Error Another type of conditional independence occurs when a cause gives rise independently to two different effects, as depicted in Figure 3. This type of graph structure is known as diverging. In this example, “High blood pressure” and “Diabetes” are conditionally independent given the value of “Weight gain,” but are correlated due to the influence of the common cause. That is, the two effects typically either co-occur (when the common cause is present) or are both absent (when the common cause is absent). This type of conditional independence relationship is quite useful for diagnosing the presence of root causes that can lead to multiple independent effects that each influence different sentinel events. For example, understaffing might lead to several different intermediate causes, each of which could be a precursor of different sentinel events. If several of these precursor events were to be observed, one could infer that the understaffing problem was sufficiently severe to impact patient care. Proactive remediation could then be initiated prior to the occurrence of serious adverse medical outcomes.
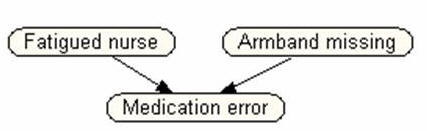
Figures 2 and 3 illustrate serial and diverging causal structures, respectively. As we have seen, a serial structure represents the action of an indirect causal relationship, and a diverging structure represents multiple independent effects of a single cause. In both these cases, the two terminal nodes are conditionally independent of each other given the middle node. A different kind of causal structure, the converging structure, is shown in Figure 4. A converging structure occurs when two different causes can produce a single effect, as when either a fatigued nurse or a missing armband can cause a medication error. Notice that in this case, the terminal nodes are not conditionally independent given the middle node. For example, if the sentinel event is known to occur, and we learn that the armband was present, this will increase our probability that the nurse was unacceptably fatigued. Likewise, if we find that the armband was missing, this will reduce the likelihood that the problem was due to fatigue.
Data can be used, if available, to validate the graph structure of a causal Bayesian network. As we noted above, when a connection is serial or diverging, the terminal nodes are conditionally independent given the intermediate node. This relationship can be evaluated by holding the value of the intermediate node fixed and examining whether the terminal nodes are correlated. In the example of Figure 3, we would compute the correlation of “High blood pressure” and “Diabetes” for all cases in which there was weight gain. We would then calculate the correlation for all cases in which there was no weight gain. If both correlations were statistically indistinguishable from zero, we could conclude that the conditional independence relationships were satisfied. Similar tests can be used to evaluate conditional independence relationships for a diverging structure. In general, in a Bayesian network a node is conditionally independent of all its non-descendents given its parents. This general condition implies a set of correlations that should be equal to zero if the structure is correct. Although it is tedious to verify all these relationships by hand, it is straightforward to automate the verification process, and computer programs have been written to accomplish the task. Given the structure of an acyclic causal graph, one can read off the assumed conditional independencies. Conditional independencies are identified through examining serial or diverging graphs in causal model so that removal of the condition would sever the directional flow from the cause to the effect. Often, a complicated Root Cause Analysis can be broken into smaller components containing serial and diverging structures. If these structures are observed and if removal of the condition in these structure would sever the link between the other two nodes, then a conditional dependencies has been identified. Careful examination of conditional independence relationships is an important element of specifying and validating a Bayesian Network for root cause analysis. Validation of Conditional IndependenceOnce conditional independencies have been identified, the assumptions can be verified by examining data or by querying experts. If data is available, in a serial structure, the correlations between root cause and sentinel event should equal to the correlation between root cause and direct cause times the correlation between direct cause and sentinel event. R root cause, sentinel event = R root cause, direct cause * R direct cause, sentinel event
In a diverging structure, a similar relationship should hold. In particular, correlation between the two effects should be equal to the multiplication of the correlation between the cause and each effect: R effect1, effect2 = R cause, effect1 * R cause, effect2
If data are not available, the analyst can ask the investigative team to verify assumptions of conditional independence based on their intuitions. For example in the serial structure in Figure 2, if we know that the nurse was fatigued, would information about staffing add much to our estimate of the probability of medication error. Another way to ask the same questions is to ask if understaffing affects medication errors only through creating a fatigued nurse. In this method, the exclusivity of the mechanism of change is checked. Still another way of verifying conditional independence is through asking for estimates of various probabilities. One might ask:
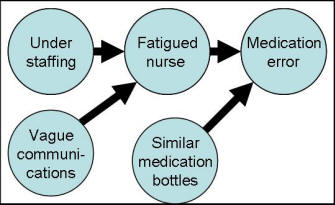
If conditional independence is violated, then the serial or diverging structures in the graph are incorrect. If these conditions are met, then the causal graph is correct. Lets look at slightly more complicated set of causes. Figure 4 shows four proposed causes for medication error: understaffing, fatigued nurse, vague communication, and similar medication bottles. Two root causes (understaffing and vague communications) are shown to precede the direct cause "fatigued nurse." Removing the node "fatigued nurse" would stop the flow from these two root causes to the medication error. Therefore, a conditional independence is assumed. This assumption can be verified either through data or through experts judgments. Let us assume that if we know that the nurse is fatigued, understaffing adds no additional information to probability of medication error. So this independence is verified. But suppose that even when the nurse is not fatigued, vague communications may lead to medication errors. Therefore, the assumption of conditional independence of vague communication and medication error is not met.
Figure 4: Four possible causes of medication error & their relations Therefore, the causal network needs to be modified. Further exploration may indicate that vague communications, similar bottles, and fatigued nurse directly affect medication errors. This example shows how verifying conditional independence could help us revise root cause analysis. Predictions from Root CausesThe causal model behind the root cause analysis can be used to predict the probability of the sentinel event and this probability can then be compared to the intuitions of the investigative team. The probability of sentinel event can be calculated from each of the direct causes and the probability of direct causes can be calculated from their root causes. p (Sentinel event, Various causes) = To calculate, the probability of sentinel event, S, given a set of different unobserved (CU) and observed causes (Ci), we can use the following formula:
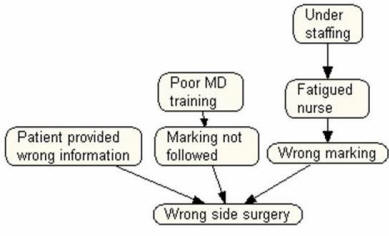
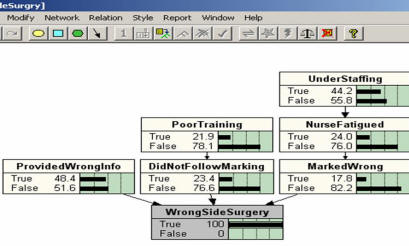
The above formula requires one to carefully track numerous probabilities. Because these calculations are tedious, investigative teams can use widely available software, e.g. Netica (TM), to simplify the calculations. Download► An example can demonstrate how such calculations are made using the software . Suppose that Figure 5 shows root causes for wrong side surgery in a hospital. First, note that the root causes listed are poor MD training, and over staffing as it contributes to fatigued nurse. These are the root causes because they are independent of sentinel event given the various direct causes. The direct causes listed are nurse marking the patient wrong, surgeon not following the markings and patient providing wrong information. These are direct causes because an arc connects them to the sentinel event.
Figure 5: Root causes for wrong side surgery Given the Root Cause Analysis in Figure 5, the next step is to estimate the probability of the various cause and effects. These probabilities are obtained by asking the expert to assess the conditional probabilities implied in the graph. Each node is conditioned on its direct causes. For example, to estimate the probability of having a fatigued nurse, the facilitator needs to ask the investigative team the following two questions:
Obviously, estimates of probabilities from experts is subjective and therefore may be unreliable. But if experts are provided with tools (calculators, paper, pencils), brief training in concept of conditional probabilities, available objective data (e.g. JCAHO's reports on prevalence of various causes), and if experts are allowed to discuss their different estimates, then experts' estimates are sufficiently accurate and reliable to provide a useful model. These probabilities may not be accurate to the last digit, but can provide for a test of consistency. Suppose that through interviewing experts or through analysis of data of the hospital, the investigative team has estimated the following probabilities:
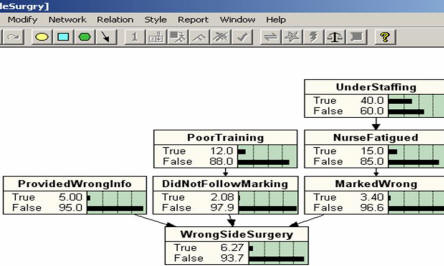
Using these estimates we can calculate the probability of wrong side surgeries when no information about any cause are present as 0.07 (see Figure 6 for an example analysis using Netica (TM) software available through Norsys). Does this seem reasonable to the investigative team? If the probability is higher by an order of magnitude from what the investigative team expected, then perhaps important constraints that prevent wrong side surgeries have been left out of the analysis. If it is too low by an order of magnitude, then an important cause or mechanism by which wrong side surgeries occur might have been missed. If it is in the ball park but not exactly what we expected, then perhaps the estimated probabilities might be wrong. In any case, when there is no correspondence between the probability of the sentinel event and the investigative team's intuition, it is time to re-think the analysis and its parameters.
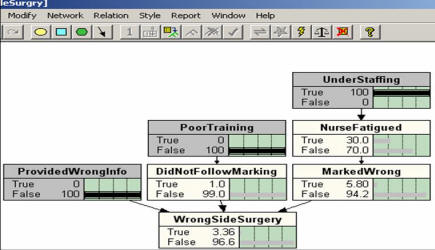
Figure 6: Application of Netica Software to Root Cause Analysis in Figure 5 Other probabilities can also be calculated and compared to the experts' intuitions. Suppose on a particular unit in a particular day, we find the nurse was fatigued but the clinician was well trained and the patient provided accurate information. Given the above estimates and the root cause in Figure 5, the probability of wrong side surgery on this day is calculated as: 0.03 (See Figure 7). If this corresponds to the investigative team's expectation, then the analysis is consistent and we can proceed. If not, we need to examine why not and look for adjustments that would fit the model predictions to experienced historical rates.
Figure 7: Probability of wrong side surgery when the
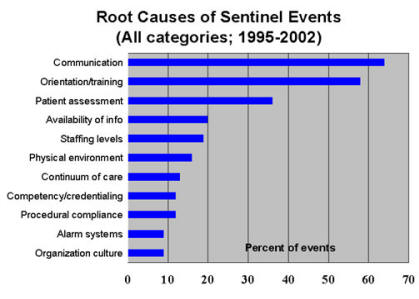
patient has provided Reverse PredictionsThe Bayesian network can also be used to calculate the probability of observing a cause given an effect has occurred. This is the reverse of how most people think about causes and effects. Most people start with a cause and want to predict the probability of the effect. Bayesian probability models allow us to do the reverse. One can start with known sentinel events and ask about the prevalence of a particular cause among them. Since causes are not as rare as sentinel events, this procedure allows us to check on the adequacy of the analysis without having to wait a long time for reoccurrence of the sentinel event. To make matters easier, the Joint Commission on Accreditation of Healthcare Organizations publishes prevalence of categories of causes among sentential events. These data can be used to examine the consistency of the Root Cause Analysis. Large discrepancy between observed prevalence of causes among sentinel events and assumed prevalence of causes in the investigative team's model suggest errors in assignments of probabilities as well as possible missed cause or constraint.
Figure 8: JCAHO's Report on Various Categories of Causes for Sentinel Events There are a number of software systems that allow the calculation of reverse probabilities in a Root Cause Analysis. Using Netica software we calculated the prevalence of over staffing in our model of wrong side surgeries. We started by setting the probability of wrong side surgery to 100%. Then we allowed the software to calculate the prevalence of over staffing.
The software calculated that overstaffing is present in 44% of wrong side surgeries. Is this a reasonable estimate? In contrast, JCAHO reports staffing levels to be a cause of sentinel event less than 20% of the time (see Figure 8). Obviously, there are many reasons for a health care organization to differ from other aggregate data reported by JCAHO. But JCAHO's data can be used as a rough benchmark. The two probabilities differ considerably. These differences suggest the need to think again through the analysis. Summary of Proposed Method for Root Cause analysisSentinel events can be reduced if health care organization create a blame-free environment, conduct Root Cause Analysis and take concrete actions on the basis of the analysis. To conduct root cause analysis we propose the following steps:
DiscussionInvestigative teams often rely on their own intuitions for listing the root causes of a sentinel event. They rarely check the validity of their analysis. In this paper, we have shown how Bayesian networks can be applied to root cause analysis to test the validity and/or consistency of the analysis. Real analysis should be a careful examination of facts and not a cover for wishful speculation. By creating a Bayesian Network and estimating the probabilities of various events, one can scrutinize assumptions made in root cause analysis. In particular, one can check to see if important root causes have been missed, if the analysis is focused on root causes or direct causes, if frequency of sentinel event corresponds to expectations and experienced rates, if prevalence of causes of sentinel events correspond to known rates, and if assumptions of dependence or independence are wrong. These are not exact ways of checking the accuracy of the analysis. But these methods allow us to check the intuition of investigative teams and help them think through the implication of their analysis. Examples of Root Cause Analysis
Bi-weekly ProjectAdvanced learners like you, often need different ways of understanding a topic. Reading is just one way of understanding. Another way is through writing. When you write you not only recall what you have written but also may need to make inferences about what you have read.
Bring your work to class on disk. See examples. Rape on campus► Medication error► Prescription errors► Analysis of falls (in Arabic)► Slides and Narrated SlidesThese audio/visual resources may be of further assistance to you in understanding this topic:
Narrated slides and videos require Flash. Download► More
Copyright © 2004 Farrokh Alemi, Ph.D. Created on 3/24/2004. Most recent revision 10/19/2017. This page is part of the course on Decision Analysis, the lecture on Root Cause Analysis & Causal Networks. |
|||||||||||||||||||||||||||||||||||||||||||||||||||||||||||||