|
Time Period |
Ratings of 1st Subject |
Ratings of 2nd Subject |
Ratings of 3rd Subject |
Ratings of 4th Subject |
Observed average |
Upper Control Limit |
Lower Control Limit |
Standard deviation of the period |
|
1 |
80 |
84 |
82 |
80 |
81.5 |
79.24 |
75.26 |
1.01 |
|
2 |
70 |
72 |
74 |
70 |
71.5 |
79.24 |
75.26 |
1.01 |
|
3 |
76 |
78 |
76 |
78 |
77 |
79.24 |
75.26 |
1.01 |
|
4 |
80 |
78 |
78 |
80 |
79 |
79.24 |
75.26 |
1.01 |
|
|
|
|
|
|
|
|
|
|
|
Grand average |
77.25 |
|
|
|
|
|
|
|
Standard deviation |
4.06 |
|
|
|
|
|
|
These data were calculated using the following formula:

Answer to Question 2
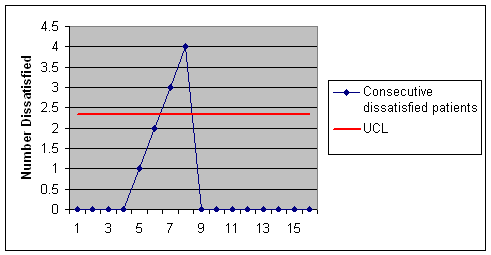
The control chart looks like the following Figure:

This chart is based on the following data:
|
Time period |
Visit number |
Rating |
Satisfied? |
Consecutive dissatisfied patients |
UCL |
|
|
|
1 |
1 |
80 |
Yes |
0 |
2.33 |
Count satisfied |
12 |
|
1 |
2 |
84 |
Yes |
0 |
2.33 |
|
1 |
3 |
82 |
Yes |
0 |
2.33 |
Count satisfied |
4 |
|
1 |
4 |
80 |
Yes |
0 |
2.33 |
|
2 |
5 |
70 |
No |
1 |
2.33 |
R |
0.33 |
|
2 |
6 |
72 |
No |
2 |
2.33 |
|
2 |
7 |
74 |
No |
3 |
2.33 |
UCL |
2.33 |
|
2 |
8 |
70 |
No |
4 |
2.33 |
|
3 |
9 |
76 |
Yes |
0 |
2.33 |
|
|
|
3 |
10 |
78 |
Yes |
0 |
2.33 |
|
|
|
3 |
11 |
76 |
Yes |
0 |
2.33 |
|
|
|
3 |
12 |
78 |
Yes |
0 |
2.33 |
|
|
|
4 |
13 |
80 |
Yes |
0 |
2.33 |
|
|
|
4 |
14 |
78 |
Yes |
0 |
2.33 |
|
|
|
4 |
15 |
78 |
Yes |
0 |
2.33 |
|
|
|
4 |
16 |
80 |
Yes |
0 |
2.33 |
|
|
The formulas used to calculate these data are provided
below:

Answer to Question 3
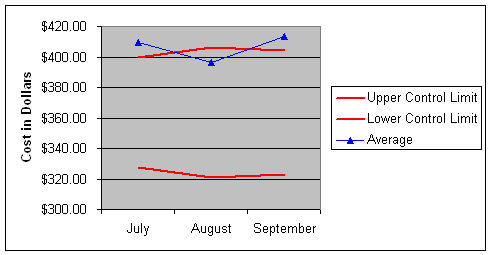
The control chart of the answer looks like the following
Figure:

The chart is based on the following data:
|
|
Difference between observed and expected |
|
|
July |
August |
September |
|
|
|
$96.90 |
($102.13) |
$70.91 |
|
|
|
|
$80.38 |
($116.58) |
$69.65 |
|
|
|
|
$81.33 |
$65.08 |
$73.33 |
|
|
|
|
$66.59 |
($32.14) |
$76.40 |
|
|
|
|
$52.32 |
$73.62 |
$51.83 |
|
|
|
|
$58.38 |
($21.34) |
$68.78 |
|
|
|
|
$66.31 |
$12.05 |
$78.22 |
|
|
|
|
$79.87 |
($115.92) |
$97.67 |
|
|
|
|
$85.78 |
|
$76.78 |
|
|
|
|
$71.44 |
|
|
|
|
|
|
Standard deviation |
$63.48
|
|
|
|
|
Grand expected avg |
$363.66 |
|
|
|
Month |
Average |
Standard deviation of time period |
T-value |
Upper Control Limit |
Lower Control Limit |
|
July |
$409.74 |
$20.08 |
1.81 |
$400.00
|
$327.33
|
|
August |
$396.07 |
$22.44 |
1.89 |
$406.08
|
$321.24
|
|
September |
$413.16 |
$21.16 |
1.91 |
$404.17
|
$323.16
|
|
|
|
|
2.01 |
|
|
|
|
|
|
|
|
|
The data are calculated using the following formulas:


