Question 1: Requires first and last name
Question 2: Requires no help
Question 3A
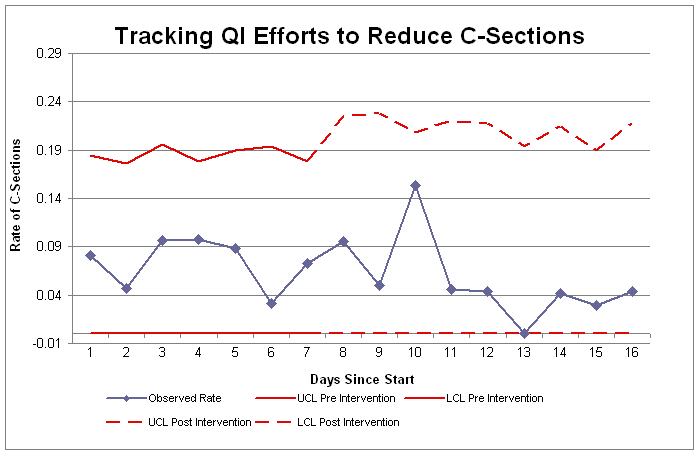
Based on the following data:
|
Day |
Number of cases |
Number of c-sections |
Observed Rate |
Standard Deviation |
UCL Pre Intervention |
LCL Pre Intervention |
UCL Post Intervention |
LCL Post Intervention |
|
1 |
37 |
3 |
0.08 |
0.04 |
0.18 |
0.00 |
|
|
|
2 |
43 |
2 |
0.05 |
0.04 |
0.18 |
0.00 |
|
|
|
3 |
31 |
3 |
0.10 |
0.04 |
0.20 |
0.00 |
|
|
|
4 |
41 |
4 |
0.10 |
0.04 |
0.18 |
0.00 |
|
|
|
5 |
34 |
3 |
0.09 |
0.04 |
0.19 |
0.00 |
|
|
|
6 |
32 |
1 |
0.03 |
0.04 |
0.19 |
0.00 |
|
|
|
7 |
41 |
3 |
0.07 |
0.04 |
0.18 |
0.00 |
0.18 |
0.00 |
|
8 |
21 |
2 |
0.10 |
0.05 |
|
|
0.22 |
0.00 |
|
9 |
20 |
1 |
0.05 |
0.05 |
|
|
0.23 |
0.00 |
|
10 |
26 |
4 |
0.15 |
0.05 |
|
|
0.21 |
0.00 |
|
11 |
22 |
1 |
0.05 |
0.05 |
|
|
0.22 |
0.00 |
|
12 |
23 |
1 |
0.04 |
0.05 |
|
|
0.22 |
0.00 |
|
13 |
32 |
0 |
0.00 |
0.04 |
|
|
0.19 |
0.00 |
|
14 |
24 |
1 |
0.04 |
0.05 |
|
|
0.21 |
0.00 |
|
15 |
34 |
1 |
0.03 |
0.04 |
|
|
0.19 |
0.00 |
|
16 |
23 |
1 |
0.04 |
0.05 |
|
|
0.22 |
0.00 |
|
Total |
484 |
31 |
|
|
|
|
|
|
|
|
|
|
|
|
|
|
|
|
|
|
p= |
0.0640496 |
|
|
|
|
|
|
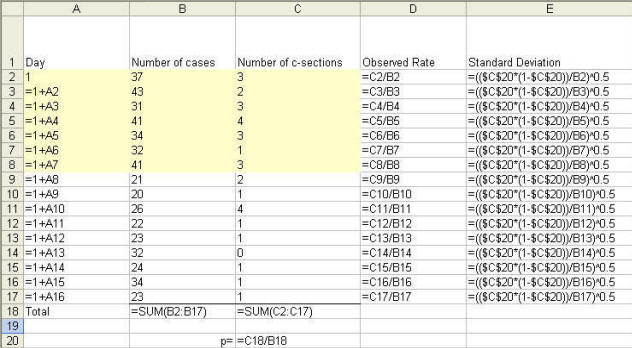
Which is based on the following formulas:
Question 3B
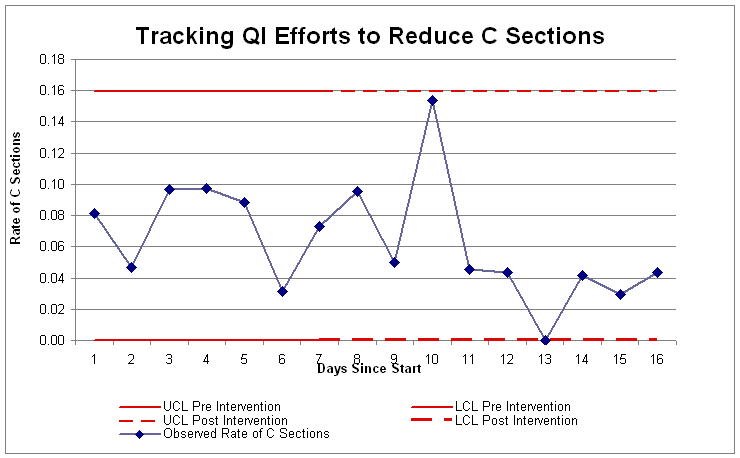
Which is based on the following data:
|
Day |
Number of cases |
Number of c-sections |
Observed Rate of C Sections |
Difference of 2 Consecutive Values |
UCL Pre Intervention |
LCL Pre Intervention |
UCL Post Intervention |
LCL Post Intervention |
|
|
|
1 |
37 |
3 |
0.08 |
|
0.16 |
0.00 |
|
|
UCL |
0.16 |
|
2 |
43 |
2 |
0.05 |
0.03 |
0.16 |
0.00 |
|
|
LCL |
0 |
|
3 |
31 |
3 |
0.10 |
0.05 |
0.16 |
0.00 |
|
|
|
|
|
4 |
41 |
4 |
0.10 |
0.00 |
0.16 |
0.00 |
|
|
|
|
|
5 |
34 |
3 |
0.09 |
0.01 |
0.16 |
0.00 |
|
|
|
|
|
6 |
32 |
1 |
0.03 |
0.06 |
0.16 |
0.00 |
|
|
|
|
|
7 |
41 |
3 |
0.07 |
0.04 |
0.16 |
0.00 |
0.16 |
0 |
|
|
|
8 |
21 |
2 |
0.10 |
|
|
|
0.16 |
0 |
|
|
|
9 |
20 |
1 |
0.05 |
|
|
|
0.16 |
0 |
|
|
|
10 |
26 |
4 |
0.15 |
|
|
|
0.16 |
0 |
|
|
|
11 |
22 |
1 |
0.05 |
|
|
|
0.16 |
0 |
|
|
|
12 |
23 |
1 |
0.04 |
|
|
|
0.16 |
0 |
|
|
|
13 |
32 |
0 |
0.00 |
|
|
|
0.16 |
0 |
|
|
|
14 |
24 |
1 |
0.04 |
|
|
|
0.16 |
0 |
|
|
|
15 |
34 |
1 |
0.03 |
|
|
|
0.16 |
0 |
|
|
|
16 |
23 |
1 |
0.04 |
|
|
|
0.16 |
0 |
|
|
|
|
Average |
|
0.07 |
0.03 |
|
|
|
|
|
|
|
|
|
|
|
|
|
|
|
|
|
|
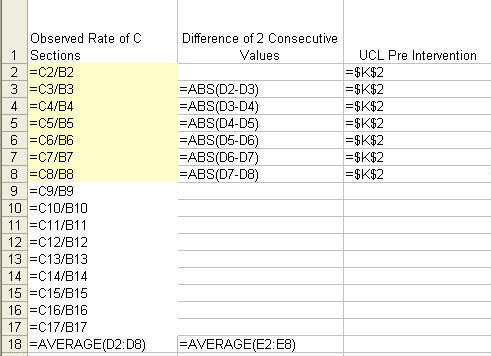
Which is based on the following formulas:
Question 3C
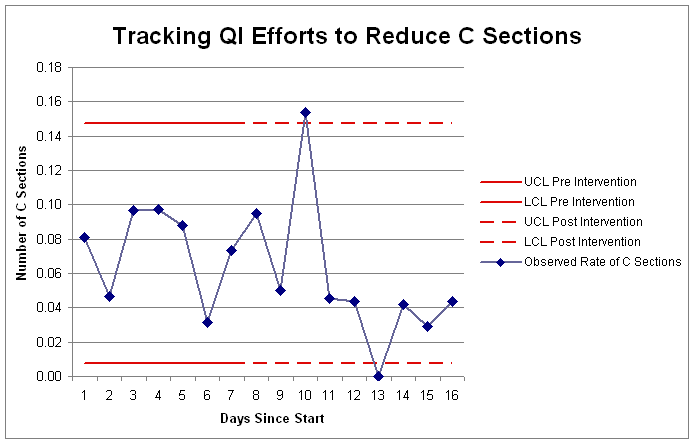
The chart looks like:
This based on the following data:
|
Number of cases |
Number of c-sections |
Observed Rate of C Sections |
Rank |
Day of Observation |
Rate of C-sections |
UCL Pre Intervention |
LCL Pre Intervention |
UCL Post Intervention |
LCL Post Intervention |
|
|
|
37 |
3 |
0.08 |
1 |
6 |
0.03 |
0.15 |
0.01 |
|
|
Median |
0.08 |
|
43 |
2 |
0.05 |
2 |
2 |
0.05 |
0.15 |
0.01 |
|
|
Upper 4th |
0.10 |
|
31 |
3 |
0.10 |
3 |
1 |
0.07 |
0.15 |
0.01 |
|
|
Lower 4th |
0.06 |
|
41 |
4 |
0.10 |
4 |
3 |
0.08 |
0.15 |
0.01 |
|
|
4th Spread |
0.04 |
|
34 |
3 |
0.09 |
5 |
5 |
0.09 |
0.15 |
0.01 |
|
|
UCL |
0.15 |
|
32 |
1 |
0.03 |
6 |
7 |
0.10 |
0.15 |
0.01 |
|
|
LCL |
0.01 |
|
41 |
3 |
0.07 |
7 |
4 |
0.10 |
0.15 |
0.01 |
0.15 |
0.01 |
|
|
|
21 |
2 |
0.10 |
|
|
|
|
|
0.15 |
0.01 |
|
|
|
20 |
1 |
0.05 |
|
|
|
|
|
0.15 |
0.01 |
|
|
|
26 |
4 |
0.15 |
|
|
|
|
|
0.15 |
0.01 |
|
|
|
22 |
1 |
0.05 |
|
|
|
|
|
0.15 |
0.01 |
|
|
|
23 |
1 |
0.04 |
|
|
|
|
|
0.15 |
0.01 |
|
|
|
32 |
0 |
0.00 |
|
|
|
|
|
0.15 |
0.01 |
|
|
|
24 |
1 |
0.04 |
|
|
|
|
|
0.15 |
0.01 |
|
|
|
34 |
1 |
0.03 |
|
|
|
|
|
0.15 |
0.01 |
|
|
|
23 |
1 |
0.04 |
|
|
|
|
|
0.15 |
0.01 |
|
|
|
|
|
|
|
|
|
|
|
|
|
|
|
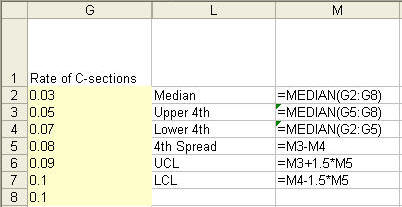
Which is based on the following formulas:
Question 4A
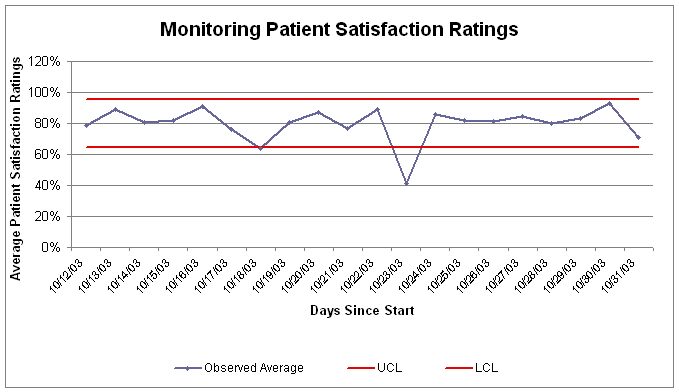
This is based on the following data:
|
Day |
Ratings by a patient at 10 am |
Ratings by a patient at 10:30 am |
Rating by a Patient at 11 am |
Rating by a patient at 12 noon |
Observed Average |
Grand Average |
Standard Deviation of all Data |
Standard Deviation of Time Period |
UCL |
LCL |
|
10/12/03 |
81% |
75% |
72% |
88% |
79% |
80% |
0.16 |
0.08 |
0.95 |
0.64 |
|
10/13/03 |
83% |
98% |
94% |
82% |
89% |
80% |
0.16 |
0.08 |
0.95 |
0.64 |
|
10/14/03 |
82% |
70% |
78% |
92% |
81% |
80% |
0.16 |
0.08 |
0.95 |
0.64 |
|
10/15/03 |
73% |
88% |
70% |
98% |
82% |
80% |
0.16 |
0.08 |
0.95 |
0.64 |
|
10/16/03 |
99% |
98% |
68% |
98% |
91% |
80% |
0.16 |
0.08 |
0.95 |
0.64 |
|
10/17/03 |
65% |
72% |
69% |
99% |
76% |
80% |
0.16 |
0.08 |
0.95 |
0.64 |
|
10/18/03 |
21% |
90% |
64% |
80% |
64% |
80% |
0.16 |
0.08 |
0.95 |
0.64 |
|
10/19/03 |
61% |
87% |
87% |
88% |
81% |
80% |
0.16 |
0.08 |
0.95 |
0.64 |
|
10/20/03 |
97% |
68% |
86% |
97% |
87% |
80% |
0.16 |
0.08 |
0.95 |
0.64 |
|
10/21/03 |
70% |
74% |
79% |
83% |
77% |
80% |
0.16 |
0.08 |
0.95 |
0.64 |
|
10/22/03 |
83% |
96% |
91% |
85% |
89% |
80% |
0.16 |
0.08 |
0.95 |
0.64 |
|
10/23/03 |
62% |
60% |
22% |
21% |
41% |
80% |
0.16 |
0.08 |
0.95 |
0.64 |
|
10/24/03 |
77% |
93% |
91% |
81% |
86% |
80% |
0.16 |
0.08 |
0.95 |
0.64 |
|
10/25/03 |
81% |
87% |
78% |
83% |
82% |
80% |
0.16 |
0.08 |
0.95 |
0.64 |
|
10/26/03 |
99% |
79% |
64% |
84% |
82% |
80% |
0.16 |
0.08 |
0.95 |
0.64 |
|
10/27/03 |
92% |
87% |
80% |
80% |
85% |
80% |
0.16 |
0.08 |
0.95 |
0.64 |
|
10/28/03 |
77% |
80% |
77% |
86% |
80% |
80% |
0.16 |
0.08 |
0.95 |
0.64 |
|
10/29/03 |
63% |
98% |
86% |
87% |
84% |
80% |
0.16 |
0.08 |
0.95 |
0.64 |
|
10/30/03 |
93% |
97% |
91% |
91% |
93% |
80% |
0.16 |
0.08 |
0.95 |
0.64 |
|
10/31/03 |
64% |
73% |
61% |
87% |
71% |
80% |
0.16 |
0.08 |
0.95 |
0.64 |
Which is derived from the following formulas:

Question 4B
|


