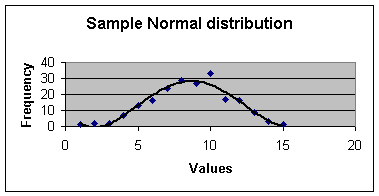
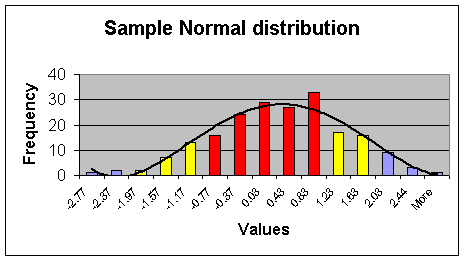
Standard Deviation of ObservationsYou know how to average data. Now you can learn how to calculate standard deviation, the next most fundamental concept in statistics. In a Normal distribution, most of the data are near the average and the likelihood of observing something away from the average becomes increasingly small. It is a symmetric distribution that looks like a bell. The shape below was generated from 200 values that came from a Normal distribution:
The x-axis (the horizontal one) is the values of the distribution. The y-axis (the vertical one) is the number of times a particular value is observed. Not all Normal distributions will have the same flatness. Some will have more values near the mean and few values on the two ends, they curve will look like a slender tall bell. Others will be flat like the above picture. Standard deviation tells you how tightly the distributions values are clustered around the mean. Large standard deviations imply more flat distributions.
Imagine one standard deviation around the mean, roughly the red areas in the graph. Sixty eight percent of the data fall within plus or minus of one standard deviation away from mean. Ninety five percent of the data (roughly the red and yellow areas) fall within two standard deviations away from the mean. And three standard deviations (the red, yellow and blue) account for about 99 percent of the data. Thus, standard deviation allows us to translate the observation to a probability of observing it. We could, for example, say that a data point that is 4 standard deviations away is indeed rare. Here is the formula for computing the standard deviation.
In the above formula, S is the standard deviation. X is the
observation. M is the mean of the observations and N is the number of
observations. If the number of observations is less than 30 use N-1
instead of N.
Excel Formula
Standard deviation is calculated in Excel by the function Stdev. This
function estimates standard deviation based on a sample. The syntax for the
function is:
=STDEV(number1,number2,...) Number1, number2, ... are 1 to 30 number arguments corresponding to a sample of a population. You can also use a single array or a reference to an array instead of arguments separated by commas. To insert this function, first put your cursor in the cell where you want the standard deviation to be calculated. Second, enter the formula "=stdev(range)", where range is the starting and ending cells of your data. Calculation of Standard Deviation In a Normal distribution the standard deviation is the square root of the average of the squared deviations from the mean. So to calculate the standard deviations you take the following steps:
Standard deviation measures the dispersion of data around the average. If all data are close to the average, then the standard deviation will be small. If they are far from the average, then the standard deviation will be large. ExampleFor example, the following Table shows how the standard deviation of observations was calculated:
Table 1: Calculation of Standard Deviation Copyright © 1996 Farrokh Alemi, Ph.D. Created on Sunday, October 06, 1996 4:20:30 PM. Most recent revision was on 09/04/08.
|
||||||||||||||||||||||||||||||||||||||||||||||||||||||||||||||||||||||||||||||||||||||||||||||||||||||||||||||||||||||||

