
Measuring Severity from Claims Data
This page was last updated on Friday, January 27, 2017. This page is based on the following publication: Alemi F, Walters SR. “A mathematical theory for identifying and measuring severity of episodes of care.” Quality Management in Health Care. 15.2 (Apri-Jun 2006): 72-82. Read►
Introduction
Because of lack of randomization it is difficult to attribute the patient outcomes to quality of care as opposed to patient’s severity of illness. This note shows how severity of patient’s illness can be measured through extant data in your records. A recent patent application allows researchers to estimate severity of episodes of illness from data on time of diagnoses and nature of diagnoses.
Procedures for Calculation of Severity
The procedure described here assume that one has
access to a large claims file containing a measure of patient outcomes
(typically charges or paid charges) and measures of illness (typically
diagnoses as coded in International Classification of Diseases, ICD).
The data can come from only clinic visits, both clinic and
hospital visits or only hospital visits.
The data are assumed to provide longitudinal information on the
same patient. There are
several distinct steps in creation and testing of the severity index:
- Clean the data to remove
contradictory information
- Organize subsets of the
data to allow easier statistical analysis of very large databases
- Estimate severity of each
diagnosis
- Estimate severity of
multiple diagnoses of a patient
- Evaluate the accuracy of
the estimates
Each of these steps is further clarified in the
following.
Clean the Data
The first step is to clean the claims data.
There are a number of obvious problems in claims data:
-
First, check for impossible negative numbers (e.g. negative charges or
negative length of stay).
Negative
charges often reflect denial of charges or denial of money
paid for charges. These
charges must be matched with the original paid amount and the balance
reported. There are fewer occasions
in which a negative length of stay shows, so it may be best for the
dependent variable.
-
Second, if charges are used as the dependent
variable, pay attention that there are a number of occasions that charges for the same
patient at the same time period are paid in different occasions. As a
consequence of this situation, some entries in the claims file have very
low charges. All charges for
the same hospitalization must be combined.
-
Third, there are a number of occasions of zero charges
or zero length of stay.
Zero charges in claims file often indicate a correction of
disease classification or other minor corrections.
The cleaning of data should note the change in diagnosis over
the two claims and make the correction in the case.
-
Fourth, many diagnosis codes include procedures.
These constitute overlapping information and the procedure codes
should be eliminated to avoid the overlap.
-
Fifth, the setting of the diagnosis matters.
Clinic and hospital visits will have radically different cost
structure for addressing the same diagnosis.
The diagnosis codes should be modified to indicate whether the
setting was in a hospital or a clinic.
This is typically done by adding an “H” to the diagnosis code.
- Some hospitals report Dead on Arrival as a hospital stay of 0 days. Others do not report these cases as a hospital admission. A consistent approach should be used. One could, for example, exclude from analysis patients who have died and have stayed for 0 days.
-
There are also errors in claims files that correspond to data entry
errors (e.g. use of ICD code that has no valid interpretation).
These cases should be deleted from the analysis.
-
Finally, note that
The enclosed video shows how data from Healthcare Utilization Project of Agency for Healthcare Quality and Research can be prepared for the analysis. The key in this preparation is to select appropriate cases across all 15 diagnosis fields included in these files.
Organize Subset of Data
The statistical analysis of very large databases is
problematic by its sheer size.
Since some visits involve multiple diagnoses, it is important to discern
which of several codes should be rated as higher in severity.
Imagine two cases one in which the patient presents with Myocardial
Infarction and Congestive Heart Failure and another where the patient
presents with Myocardial Infarction and shock. In trying to find
out the severity of myocardial infarction it is important to separate
out the effect of shock or the effect of congestive heart failure that
accompanied the infarction. One way to do so is through analysis
of variance. While conceptually the analysis is simple,
practically it is difficult to conduct an analysis of variance with more
than 10,000 variables (one variable is needed for each diagnosis).
Typically, dividing the diagnoses into several sets of related codes and
conducting separate Analysis of Variance for each set is one
possibility.
To reduce the size of the data, statistical analysis is done separately
for each diagnosis. Since
there are more than 10,000 diagnoses, this leads to significant
reduction in data and enables easier analysis of variance.
To organize data into subset, all cases in which a particular
diagnosis has occurred is selected.
The statistical analysis, described in next step, is carried out
and the results are fed back into subsequent analysis.
Estimate Severity of Each Diagnosis
Assigning a severity score to each diagnosis requires the
re-organization of the data.
Typically, up to 10 diagnoses are listed for each case in the claim data
file. Different diagnoses
are listed in the same field titled primary, secondary, etc.
This must be reorganized so that each diagnosis is listed as a
separate field. When the
diagnosis is present a value of 1 is assigned and when absent a value of
0 is assigned. Table one
shows how typical claims data are organized.
|
Case number |
Charges |
Amount Paid |
Status at
discharge |
Primary diagnosis |
2nd Diagnosis |
… |
10th Diagnosis |
|
1234 |
15000 |
12000 |
Alive |
410 |
250 |
||
|
1235 |
27000 |
19000 |
Alive |
560 |
410 |
312 |
|
|
Table 1: Typical
Layout of Data |
|||||||
|
Case number |
Charges |
Amount Paid |
Discharged alive |
ICD410 |
ICD250 |
ICD560 |
ICD312 |
… |
|
1234 |
15000 |
12000 |
1 |
1 |
1 |
0 |
0 |
|
|
1235 |
27000 |
19000 |
1 |
1 |
0 |
1 |
1 |
|
|
Table 2: Revised Set
up |
||||||||
(1) Analysis of Variance
A
regression analysis is done so that the dependent variable is amount
paid, the independent variables are whether the patient was discharged
alive and all other diagnosis within the data subset and the last
variable in the regression is the target diagnosis:
![]()
In the above equation, the parameters α, β, … are estimated from the
data. The variables ICDxxx,
ICDyyy, … reflect all diagnoses that is present in the subset and
ICDTarget reflects the diagnoses used to organize the subset.
The value of coefficient δ is referred to relative severity score
for the target diagnosis.
In this approach, a Multi-Attribute Utility model is fitted to the measure of overall severity of a case, e.g. mortality or length of stay. The severity of case x, u(x), is assumed to be proportional to mortality or length of stay and is calculated as:
![U(x) = \frac{1}{K}({\prod[Kk_iU_i(x_i)+1]}-1)](UtilityModel.png)
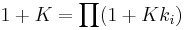
where U(x) is scaled from 0 to 1, xi is the code for diagnosis i, Ui(xi) is 1 when diagnosis i is present and zero otherwise, ki is the single attribute scaling constant which reflects the severity of diagnosis i, and K is the normalizing constant which scales U(x) from 0 to 1. The value of K is derived from:
(3) Averaging
n alternative approach, one that approximates the severity of each diagnosis is to simply take the average value for each diagnosis. Taking the average for each diagnosis is an approximation because it does not adequately control for the presence of different co-morbidities. This approach maybe reasonable when dealing with very large number of cases, e.g. in excess of several millions.
![]()
In the above equation, the maximum and minimum refer to the maximum and
minimum relative score among all diagnoses.
Estimate Severity of a case
The next step is to calculate the overall severity of illness of each
patient given their set of diagnoses. The severity of a patient’s
illness is calculated by looking at all diagnoses of the patient up to a
certain point in time. For example, if you are looking at one year
of data, you look at all of the diagnoses of the patient during that
year. The overall severity of the illness is calculate through the
multi-linear utility model presented earlier. For simplicity, one
can also calculate the overall severity using the following formula,
where severity of diagnosis “i” is shown as ki:
Overall severity = 1-
∏i (1
- ki) for all diagnoses i for
the same patient
For example, if a patient has two diagnoses, one with severity score 0.9
and another with severity score 0.5, then the overall severity of the
episode is calculated as:
Overall severity = 1 - (1 - 0.9) * (1 - 0.5) = 0.95
Evaluate Accuracy of Severity Index
To evaluate the severity of the index, data not used in construction of the index are used. A severity score is calculated for each patient in this new data set. The percent of variance in paid charges that is explained by the severity index is reported. Different methods can be used in comparing two indices:
- If predicting length of stay, then Analysis of variance
can be used to measure the percent of
length of stay explained by the different co-morbidity and
severity indices. For example, the following regression model will test if
the Alemi’s approach to measurement of severity adds
additional information beyond what is captured by Charlson’s approach.
Length of stay= a (Charlson index) + b(Alemi index) + e
In this equation, length of stay is the dependent variable. The Charlson and Alemi indices are the independent variables and parameters a, and b are estimated from the data through regression analysis and e indicates a random error term. If the parameter b is significantly different from zero then the hypothesis that the Alemi index does not add new information to Charlson’s prediction is rejected. The percent of variance explained by each index is used to provide a benchmark of the accuracy of each index.
- The accuracy of indices in predicting mortality rates can also be compared using receiver operating curves. PubMed►
Here is a video showing how three different indices (APR-DRG, APS-DRG and Alemi et al. Index) perform. Video► You Tube►
Conclusions
Electronic health records have made a large amount of data available. Clincians' diagnoses are coded and available in electronic health records. These data can be used to measure the severity of illness of the patients.
References
[1] Lemay R, Mawudeku A, Shi Y, Ruben M, Achonu C. Syndromic surveillance for influenzalike illness. Biosecur Bioterror. 2008 Jun;6(2):161-70.
[2] Miller MR, Elixhauser A, Zhan C, Meyer GS. Patient Safety Indicators: using administrative data to identify potential patient safety concerns. Health Serv Res. 2001 Dec;36(6 Pt 2):110-32.
[3] Rosen AK, Rivard P, Zhao S, Loveland S, Tsilimingras D, Christiansen CL, Elixhauser A, Romano PS. Evaluating the patient safety indicators: how well do they perform on Veterans Health Administration data? Med Care. 2005 Sep;43(9):873-84.
[4] Zhan C, Miller M. Administrative data based patient safety research: a critical review. Qual Saf Health Care. 2003 December; 12(Suppl 2): ii58–ii63. doi: 10.1136/qhc.12.suppl_2.ii58.