Benchmark Using Social Media
Assigned Reading
Presentations
Narrated slides and videos require Flash. Download► AssignmentData: To complete the project, you can collect comments made about a topic on the web. In order to make the task easier, we have gathered from the web comments made about pediatricians and OB-GYN physicians in DC. Download DC Pediatrics► Download DC OBGYN► Analysis: Two types of analysis are done. Benchmarks are prepared by calculating time-to-next complaint. See videos and papers assigned for this lecture to learn how you can do so. Remember to set clinicians with no complaints to the time between oldest and most recent comments. The last task is to prepare a presentation about your work. Your audience is directors of health administration programs across the nation. Your presentation should clarify how sentiment analysis works and why this is a better method than alternative methods. Video: If you are preparing the video, the audience are program managers and your task is to convince them of the value of sentiment analysis. The video should have the following sections:
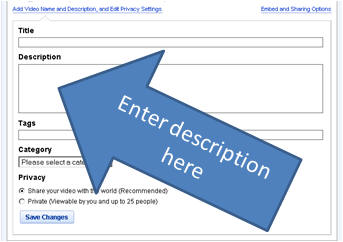
The video should not exceed 10 minutes and should be posted on You Tube. Please include the following statement in the description of the video:
"This video shows how minute survey and text classification programs (sentiment
analysis) can detect service problems within an educational program. This analysis
relies on data taken from the web and is focused on health administration
programs. These data were analyzed as part of course on health information
systems at George Mason
University. This course was taught by Farrokh Alemi, Ph.D., Phan Giang,
Ph.D., and Hamid Jallal" See example of student work in the context of analysis of sentiments towards physicians: You Tube 1► You Tube 2►
This page was edited
|
