 |
 |
Answer to Question 1 in Comparison of Means |
||||||||||||||||||||||||||||||||||||||||
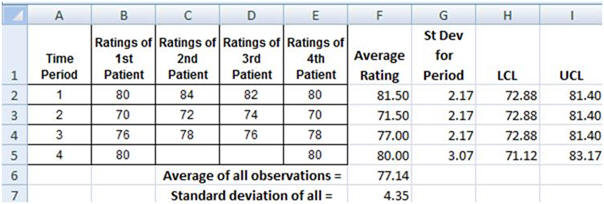
QuestionQuestion 1. Assume that in different time periods 4 randomly selected patients rated their satisfaction with our services as follows: Download► Answer
AnswerTo answer this question we need to calculate the control limits for each time period. First calculate the average for each time period. Second, the average of all observations. Third, the standard deviation of all observations. Finally fourth, calculate the standard deviation for each time period. Now, you are ready to calculate the Upper and Lower control limits. The formula for these calculations and the resulting findings are given below:
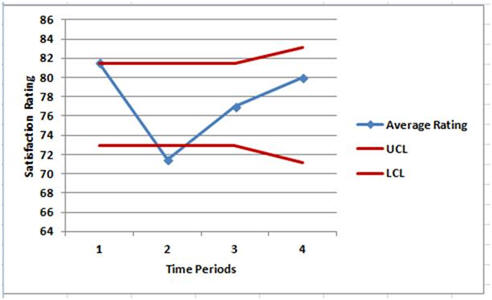
Then you can plot the control limits and the observations. Note that the UCL and LCL are drawn without markers and in red. Note how the UCL and LCL for the 4th time period is wider than other time periods. This is because there are only 2 observations in this time period and therefore we have a larger standard deviation. Also note that the 2nd time period falls below the control limits showing that in this time period we did worse than usual.
|
|
Copyright © 1996 Farrokh Alemi, Ph.D. Most recent revision 08/03/2018. This page is part of the course on Statistical Process Control, this is the lecture on Introduction. |