|
|
||||||||||||||||||||||||||||||||||||||||||||||||||||||||||||||||||||||||||||||||||||||||||||||||||||||||||||||||||||||||||||||||||||||||||||||||||||||||||||||||||||||||||||||||||||||||||||||||||||||||||||||||||||||||||||||||||||||||||||||||||||||||||||||||||||||||||||||||||||||||||||||||||||||||||||||||||||||||||||||||||||||||||||||||||||||||||||||||||||||||||||||||||||||||||||||||||||||||||||||||||||||||||||||||||||||||||||||||||||||
 |
||||||||||||||||||||||||||||||||||||||||||||||||||||||||||||||||||||||||||||||||||||||||||||||||||||||||||||||||||||||||||||||||||||||||||||||||||||||||||||||||||||||||||||||||||||||||||||||||||||||||||||||||||||||||||||||||||||||||||||||||||||||||||||||||||||||||||||||||||||||||||||||||||||||||||||||||||||||||||||||||||||||||||||||||||||||||||||||||||||||||||||||||||||||||||||||||||||||||||||||||||||||||||||||||||||||||||||||||||||||
Benchmarking Clinicians |
||||||||||||||||||||||||||||||||||||||||||||||||||||||||||||||||||||||||||||||||||||||||||||||||||||||||||||||||||||||||||||||||||||||||||||||||||||||||||||||||||||||||||||||||||||||||||||||||||||||||||||||||||||||||||||||||||||||||||||||||||||||||||||||||||||||||||||||||||||||||||||||||||||||||||||||||||||||||||||||||||||||||||||||||||||||||||||||||||||||||||||||||||||||||||||||||||||||||||||||||||||||||||||||||||||||||||||||||||||||
|
In hiring, promoting and managing clinicians, managers often need to understand the efficiency and effectiveness of clinical practices. Clinicians are compared based on a single statistic (usually risk-adjusted expected cost). This chapter describes how to organize benchmarking efforts. Managers are focused on the survival of their organization, which often translates to two overarching objectives: improve productivity and increase market share. Clinicians' decision making affects both the organization's productivity and its market share. Poor clinicians are bad for the patient as well as for the organization. Inefficient clinicians increase cost of care for everyone. Clinicians with poor quality of care affect the reputation of the organization and de facto its market share. Managers who ignore poor quality of care among their clinicians and focus on non-clinical issues, are failing to see the real causes of their organization's malaise. If a manager is serious about improving the long term financial performance of his/her organization, he/she has no choice but to address clinicians' practice patterns. For a long time, managers have avoided addressing the quality of clinical decisions on the grounds that they do not have sufficient training to understand these decisions and because such managerial interventions would be an un-welcomed intrusion in the patient/provider relationship. But are these criticisms valid? First, do managers need to know medicine to understand practice patterns? Managers can profile a physician by looking at the outcomes of his/her patients. They may not understand how a patient should be managed but they certainly can understand patient outcomes such as mortality, morbidity, satisfaction, health status and numerous other measures. Managers can then compare clinicians to each other and see who is performing better. Across encounters and over time, the manager detects patterns and uses this information to bring about lasting changes in practice patterns. Typically, the information is provided back to a group of clinicians who identify and propagate the best practices. The concern that benchmarking intervenes in physician and patient relationship might be a red herring. After all, practice profiles are constructed after the fact, when the patient is gone. Practice profiles do not tell us how an individual patient should be managed, they identify patterns across individual visits. In short, these profiles leave the management of individual patients in the hands of the physician. There is no interference in these clinical decisions. No one tells the clinician to prescribe certain drugs or to avoid some surgeries for a specific patient. Practice profiles document the net impact of physicians on groups of patients; as such, these profiles provide information about clinician's performance overall. Practice profiles can help patients select the best clinicians. Managers need to act responsibly about who they hire and promote and practice profiles can inform them too. Providers can use practice profiles to learn from each other. Patients, managers and providers can use practice profiles, if an only if accurate profiles can be constructed and easily communicated to them. How Should the Analysis Be Done?In benchmarking, the clinician's performance is compared to an expected outcomes of his/her peers. This expectation is set in many different ways. This section reviews some typical methods. Benchmarking Without Risk Adjustment: Comparing Clinicians to Average Performance of PeersThe most common benchmarking is to compare a clinician to the average performance of his/her peers. A statistical procedure for the analysis of means of two samples (mean of outcomes for the clinician and mean of outcomes for the peer providers) is well established. Excel software contains a tool for such analysis. Analysts can use these procedures to see if the difference in means is statistically significant. An example may demonstrate this type of benchmarking. Callahan and Battleman (2002) set out to benchmark the performance of 123 internal medicine residents at the New York-Presbyterian Hospital in New York City. The outcomes examined included following outcomes:
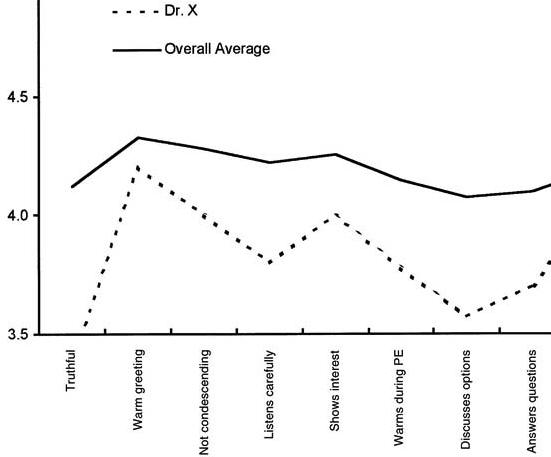
Each resident received data about his or her individual performance compared with mean data for his or her peer group (the remaining residents). Feedback was provided once every six months. Figure 1 shows an example report received by the residents. This report shows the mean for clinician X as well as the overall average of all remaining clinicians:
Figure 1: Comparing One Residents Performance
on Satisfaction with Average of Others Callahan and Battleman's benchmarking of residents was successful because the analysis identified a variety of performance patterns among residents. Some were above average and other below. Residents reacted positively to the feedback and some considered it as the "most comprehensive evaluation" they had received to date. But on the negative side, this benchmarking as well as all other efforts of comparing unadjusted mean outcomes of clinicians, has a flaw. They do not account for the severity of the illness of the patients' of the clinicians. On the surface, all patients may have the same illness and can be categorized together, but in reality some, even with the same disease, are sicker than others. Logically, worst outcomes are expected for sicker patients. Clinicians seeing sicker patients will have worst than average outcomes; not because of their performance but because they started with patients who had poorer prognosis. Naturally many clinicians question benchmarking efforts on the grounds that these efforts do not adequately account for the differences in patient populations of different clinicians. To avoid these errors and to address the concerns of clinicians regarding "apple to apple" comparisons, it is important to adjust for differences of case mix among the clinicians. The following are three suggested methods for risk adjusted benchmarking. Risk Adjusted Benchmarking: Comparing Clinicians to Peers on Patients of Similar Severity of IllnessWe present three methods of comparing clinicians on similar patients, the choice of which approach to take will depend on what data are available. In the first approach, the performance of the peer providers is simulated on the patients of the clinician being evaluated. First, the severity of the patients are noted and the probability of having patients of a particular severity group is calculated. If Pi is the probability of observing the patient in the severity group "i", Oi, clinician is the average outcome for the clinician for severity group "i", then the following formula is used to calculate expected outcomes for the clinician, Oclinician: Oclinician = ∑Pi Oi, clinciian For i =low, medium, and high severity Next, the analyst projects the performance of peer providers on the type of patients seen by the clinician being evaluated. This is done by weighing the outcomes of peer providers according to frequency of patients seen by the clinician being evaluated: Opeer providers = ∑Pi Oi, peer providers For i =low, medium, and high severity An example can demonstrate. Consider that a clinician and his/her peers have had the outcomes displayed in Table 1. Is this clinician better or worse than the peer providers? To answer this question, the analyst must compare the expected outcomes for the clinician to the the expected outcomes for the peer providers simulated on the same patients as the clinician.
The first step is to calculate the probability of finding a patient in a different severity grouping. This is done by dividing the number of patients in a severity group by the total number of patients seen by the clinician being evaluated. The probability of having a low severity patient is 20/120, medium severity patients is 30/70 and high severity patient is 70/120. This clinician mostly sees severely ill patients. Once the probabilities are calculated, the second step is to calculate the expected length of stay of the patients of the clinician being evaluated. Oclinician= (20/120)*3.1 +(30/120)*3.4 + (70/120)*5.2 = 4.4 days To understand if 4.4 days is too high or low, the analyst needs to compare this clinician's performance to his/her peer providers. But the peer providers do not see as severely ill patients as does the clinician being evaluated. To simulate the performance of the peer providers on the patients seen by the clinician, the analyst uses the frequency of severity among that clinician's patients to weigh the outcomes of the peer providers: Opeer providers = (20/130)*4.1 +(30/120)*3.0 + (70/120)*4.5 = 4.0 days The clinician, whose data we were analyzing, seems to be less efficient than the average of his peer group. Note that in both analyses we used the same frequency of having low, medium and high severity patients. Therefore, the differences cannot be due to the severity of patients. Of course, the analysis can be misleading if the classification of patients into various severity groups is at fault or if observed differences are due to random variations and not to real practice differences. But if the classification of patients into severity groups is correct, the fact that the projected length of stay for peer providers was lower than the observed length of stay for the clinician being evalauted suggests that the two may differ in their performance. Risk Adjusted Benchmarking: Comparing Clinicians to Expected PrognosisAnother way to construct meaningful risk adjusted benchmarks for a practice is to compare observed outcomes against what would be expected from patients' prognosis. A patient's prognosis can be estimated from the patient's severity on admission (as we did in Chapter 2 by constructing a severity index), from the patient's self-reported expectation or from judgment of other clinicians. Once the patient's prognosis is known, the observed outcomes can be compared and variations from the expected prognosis can be noted. For example, assume that using the APACHE severity index we have predicted the expected length of stay of 30 patients to be as indicated in Table 2:
The first step in comparing the observed and expected values is to calculate the difference between the two. Then the standard deviation of the difference is used to calculate the Student t-statistic. The student-t statistic is used to decide if the differences between observed and expected values are statistically significant. Excel provides a program for calculating the Student-t-statistics in paired observations. Using this program we obtained the results shown in Table 3:
The analysis showed that the the length of stay of patients of this clinician were lower than expected values on admission. Therefore, this clinician's practice is more efficient than the expectation. Risk Adjusted Benchmarking: Comparing Clinicians When Patient's Severity of Illness Is Not KnownAs the previous two sections have shown, in any benchmarking effort it is important to make sure that we compare clinicians on the same type of patients, otherwise it would be like comparing apples to oranges. Every provider sees a different patient. The typical approach is to measure the severity of illness of the patient and build that into the analysis. For example, in the first approach we divided patients in broad categories of severity (Low, Medium and High) and compared care provided within each category. In the second approach, patient's severity of illness was used to forecast their prognosis and compare this forecast to observed outcomes. Both methods are built on access to a reliable and valid measure of the severity of illness. Sometimes, such measures are not available or available measures do not adequately measure the full spectrum of severity of the patient's illness. This section provides an alternative method of benchmarking that does not require the availability of a valid and accurate severity index. When no severity index is available, an analyst must still make sure that apples are compared to apples by matching the patients seen by different providers feature by feature. The expected outcomes for the clinician being evaluated is calculated as: Oclinician = ∑Pj, …, m Oj, …, m, clinician for all values of j, …, m Where "j, …, m" indicates a combination of features "j" through "m", Pj, …, m indicates the probability of these features occurring and Oj, …, m, clinician indicates the clinician's outcomes when these features are present. The expected outcome for the peer providers is calculated in a similar fashion, with one difference: Opeer providers = ∑Pj, …, m Oj, …, m, peer providers for all values of j, …, m In this calculation, the probabilities are based on frequency of features among the patients seen by the clinician being evaluated but the outcomes are based on experience of peer providers. By using this formula, the analyst is simulating what the expected outcomes would have been for peer providers if they had the same patients as the clinician being evaluated. An example can demonstrate the use of this procedure. Table 4 shows 20 patients of one clinician and 24 patients of his peer providers. These patients were admitted to a hospital for myocardial infarction. In each case, we have recorded two features (existence of a previous myocardial infarction, MI, and presence of congestive heart failure, CHF). Obviously, a patient with a previous MI and with CHF has a worse prognosis than a patient without these features. The analyst needs to separate outcomes for patients with and without specific characteristics.
An event tree can be used to organize the data. An event tree is a decision tree without a decision node. Each feature can be used to create a new branch in the event tree. For example, the event tree for the patients seen by the clinician is provided as below:
Using the data in Table 4, the analyst can group patients and calculate the probabilities and average cost for clinician's patients. Figure 3 shows the result:
The expected length of stay for the patients of the clinician being evaluated was: 5.4 days. This is obtained by folding back the tree to the root node. Starting from the right (high lighted area in the formula), each node is replaced with the expected length of stay: Expected length of stay = (6 * 0.65 + 5 * (1 - 0.65)) * (0.85) + (4 * 1.0 + 0) * (1-0.85) = 5.4
Procedures for
folding back a tree were described in more detail in the
Chapter 5 on Decision Trees.
To simulate how the same patients would have been cared for
under care of peer providers, the event tree is kept as before,
but now the average length of stay of each patient grouping is
replaced with the average length of stay of patients of the peer
providers. Table 5 provides the average length of stay of
patients seen by peer providers:
Table 5: Average Stay and Probability of Observing If one combines the event tree from the clinician's patients and the outcomes of peer providers, the result is the graph in Figure 4.
The expected stay (obtained by folding back the tree in Figure 4) of the patients' of the peer providers is 5.4 days. Thus the clinician being evaluated and the peer provider have similar practice patterns. Note that if we had not changed the event tree to reflect the probabilities of patients seen by the clinician, the expected length of stay for patients seen by the provider would have been 5.75 days and we would have erroneously concluded that the clinician is more efficient than his peer. This example highlights the importance of simulating the performance of peer providers on the patients seen by the clinician. As the number of features increase, the number of data points that fall within each path on the decision tree becomes smaller. Soon most paths will have no patients. Many peer providers' cases cannot be matched on all features to the clinician's patients. When the features available do not match, the analyst can used expected outcomes to replace missing information. For example, consider if the only feature available among the clinician's patients was the presence of previous Myocardial Infarction (MI). No information was available on Congestive Heart Failure (CHF) for these patients. Now the event node available on the clinician's patient is as shown on the left of Figure 5. In addition, the outcomes for the peer providers needs to be calculated as the expected outcomes. Note from Table 5 and for patients of the peer providers, the probability of CHF for patients that have had a previous MI is calculated as: Probability of CHF given a previous MI = .42 / (.08 + .42) = .83 Similarly, the probability of CHF for patients that have not had a previous MI us calculated as: Probability of CHF given no previous MI = .38 / (.13 + .38) = .75 Figure 5 shows these probabilities and the outcomes used to calculate the expected outcome of the peer providers on patients seen by the clinician being evaluated:
Figure 5: Projecting Peer Providers Performance on the
Clinician's Patient The expected outcomes for the peer providers is given as: Opeer providers = .85*.83*6 + .85*(1-.83)*5 + (1-.85)*.75*4 + (1-.85)*(1-.75)*3 = 5.5 days A way to think about this procedure is that we have simulated the performance of peer providers on the patients of the clinician being evalauted by replacing the probabilities with the corresponding values from the clinician's experience -- whenever such probabilities are available. When such values are not available, we continue to use the probabilities from the experience of peer providers. It is also possible that some features are available in the patients seen by the clinician being evaluated but not among the patients seen by the peer providers. In these circumstances, the expected outcome for peer providers is calculated based on the event tree of the clinician being evaluated, truncated to features shared between the clinician and the peer providers. Thus, if it is not clear among the peer providers patients if they had CHF, then the event tree used to simulate the performance of peer providers is based on the experience of the clinician but without the CHF feature. In this fashion, the clinician and the peer providers can be compared even when some of the patients do not match each others' features. When no features are shared between the patients seen by the clinician being evaluated and the patients seen by peer providers, the procedure provides an unadjusted comparison of the mean of the two groups. As the number of features shared between the two groups increase, there are more adjustments for the severity of illness of the patients. Is it Reasonable to Benchmark Clinicians?Risk assessment is not as benign as it first looks. When clinicians' performance is measured and the clinician is provided with feedback, several unintended consequences may occur:
More details about the risk of benchmarking is provided by Iezzoni (1997) and Krumholz, Rathore, Chen, Wang, and Radford (2002). How Should Benchmarked Data be Presented?Managers should present their findings to clinicians. Presenting benchmarked data should be done in a fashion that helps clinicians improve their practices as opposed to acting defensively. Poorly presented information leads to unnecessary and never ending debates about the accuracy of the information presented. The Agency for Healthcare Research and Quality, Centers for Medicare & Medicaid Services and the Office of Personnel Management sponsored a working group on how to talk about health care quality (http://www.talkingquality.gov/docs/section1/default.htm). The group made a number of suggestions on the presentation of benchmarked information. The following is a modification of the group's suggestion to fit within the context of benchmarking clinicians:
References
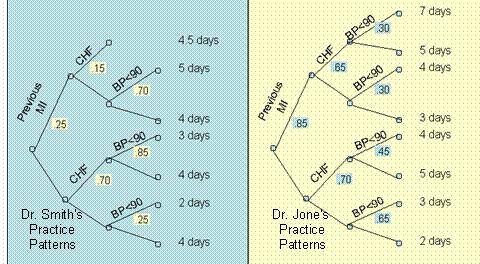
What Do You Know?In the following questions assume that we have followed two clinicians, Smith and Jones, and constructed the decision trees in Figure 6.
Send your response by email to your instructor. Include both the question and the answers in your response. Include your contact information. Biweekly ProjectSuppose you would like to benchmark three clinicians who are practicing in this area. Using the analysis found, carry out the following activities:
See examples of how a student planned to compare the practice patterns. of psychologists and a psychiatrist intern Depression► Pneumonia► Auto-immune diseases► Presentations
More
|
||||||||||||||||||||||||||||||||||||||||||||||||||||||||||||||||||||||||||||||||||||||||||||||||||||||||||||||||||||||||||||||||||||||||||||||||||||||||||||||||||||||||||||||||||||||||||||||||||||||||||||||||||||||||||||||||||||||||||||||||||||||||||||||||||||||||||||||||||||||||||||||||||||||||||||||||||||||||||||||||||||||||||||||||||||||||||||||||||||||||||||||||||||||||||||||||||||||||||||||||||||||||||||||||||||||||||||||||||||||
|
This page is part of the course on Decision Analysis, the lecture on Benchmarking Clinicians. It was last edited on 05/12/2003 by Farrokh Alemi, Ph.D. © Copyright protected. |
||||||||||||||||||||||||||||||||||||||||||||||||||||||||||||||||||||||||||||||||||||||||||||||||||||||||||||||||||||||||||||||||||||||||||||||||||||||||||||||||||||||||||||||||||||||||||||||||||||||||||||||||||||||||||||||||||||||||||||||||||||||||||||||||||||||||||||||||||||||||||||||||||||||||||||||||||||||||||||||||||||||||||||||||||||||||||||||||||||||||||||||||||||||||||||||||||||||||||||||||||||||||||||||||||||||||||||||||||||||