|
Plan, Do, Check & Act CyclesIntroductionTotal Quality Management has a rich history outside of health care. Within health care, Total Quality management (TQM) started recently but gained wide popularity quickly. From a handful of early advocates, TQM has grown to encompass almost all health care organizations. The rapid growth of TQM has led to many different variations of its implementation. Sometimes, what is called TQM in one organization is radically different from another organization. But all variations of TQM share some common steps. One approach was suggested by Batalden and colleagues (see Journal on Quality Improvement 1994, 20, 4:167-180). We have adapted the steps suggested by these authors. While we present a step by step approach, you are free and encouraged to deviate from these steps. In this regard, Batalden and colleagues write: "At any point, it is possible - and may be desirable - to step out of the prescribed step and begin an improvement trial using a Plan-do-check and act (PDCA) method. The worst that might happen is that the experiment may fail. If the trial is small scale, little harm would have been done, the need for a new change trial would have been identified, and learning would have been advanced." Objectives
Steps 1 through 4: Change the CultureIn the previous section, we highlighted the steps organizations need to go through to prepare the organization for change. We do not repeat these steps here but encourage you to read the previous lecture. More► Step 5: Assign Teams to ProblemsTQM is organized around specific problems within the organization. It is important to improve the central problems of an organization and not the most convenient ones. The problem has to be real, significant, and important to the majority of customers. Of course, any problem should be solved and any defect should be improved. But given the resources available, it is important to focus on the more important problems first. Assigning a team to a problem requires careful attention to the composition of the team. A multi-disciplinary team is needed so that team's decisions can be quickly implemented and tested. Management, nursing, physicians and other clinicians need to be involved. Defining the task of these interdisciplinary teams should be done carefully. Much can go wrong.
While little attention is paid to the art of defining a problem, it remains one of the most important steps in solving a problem. Often teams work for years on a problem that was defined in a matter of days. Spend some time and care in defining the problem right so that you will not solve the wrong or solve an inconsequential problem. Russo JE, and Schoemaker JH in their book Decision Traps identify the following issues that may affect problem definition:
Given all that can go wrong with defining a problem it is important to take time and do it right. There is little data on what is the most effective method for problem definition. But some advice can be obtained from the research in this area.
In addition to the above criteria, some investigators have suggested these additional two criteria:
State the problems in ways that is conducive to bring about rapid change to the problem. The above six criteria can guide you in this task. Step 6: Plan by Describing the ProcessTeams are often told to engage in cycles of Plan, Do, Check and Act (PDCA). A key component in planning is to describe the current process. No problem can be solved unless it is understood. When poor outcomes occur, we need to understand the process that leads to it. This section describes two ways of understanding processes. The first is known as flow charting and lists events and how they lead to one another. The second is known as listing routines and lists events in the process sequentially as they occur. Both approaches document the process. Both are useful for communicating the team's understanding to others. Both create a shared understanding of the process among the team members. Often team members are surprised at how much more goes into a process besides what they knew. Flow charting is a visual step that when communicated through story boards reassures employees that the team has understood the process. Flow charting is time consuming. A lot more than people believe. Part of the problem is that processes are complicated and charting them takes time. Another part is that team members each have a different picture of the process and they need to exchange their views about the process. The literature on group effectiveness can be used to reduce the time it takes to create a process chart. Here are the steps for flow charting a process.
An alternative to flow charting is to make lists of periodic events and work routines. Such lists are simpler to make but do not have a visual component. Despite this shortcoming, such lists may be just as useful in understanding a process. They are especially helpful in focusing the group's attention on repetitive tasks and work norms. Periodic lists are based on the principle that any system or process is best understood in terms of its “steady states;” that is in terms of events that keep recurring. Work is not a random heap of events. Some events reoccur and are referred to as routines. System Analysts refer to these reoccurring events as the “steady state” of the system. Systems are changed by changing the steady state of the system. By listing periodic events, a person can see the steady state for his or her work. The focus shifts from fringe or rare events to central and repetitive elements of a work process. The focus shifts to the small percent of activities that describe most of the observed outcomes. By listing periodic events, the work process and structure is revealed. There are many recurring events at work. Any given work process, starts with employees coming to work and ends with them leaving. In between patients arrive, information is exchanged, reports are made, meetings are kept, and numerous other activities are accomplished. The purpose of listing work routines to identify the key activities that occur within a process. The first step is to list the periodic events. It is not that non-routine events do not matter, they do; but the impact of routines events is by definition more frequent. If routine events can be understood, a big part of work process is understood. In order to list periodic events, the most useful tool is to follow a patient through the process and list discrete events that happen. Listing routines is easy because it lists events in the sequence they occur. In contrast flow charts list events in the way they influence each other, which may not be the sequence they occur. The exercise of listing routines can be more difficult than it appears. Some activities, like answer phone calls from patients, seem to follow clear patterns. Patients tend to call more on Monday mornings. Frequency of calls drops around meal time. Other activities, like disputes among employees, are not so typical and may not necessarily reoccur with a clear frequency. It is important to include all periodic events, even if they do not always occur at the same frequency. For activities with variable periods, record the average time of reoccurrence. This exercise is difficult because the variability in process activities must be distilled and ignored. We acknowledge that events do not necessarily occur at fixed intervals. This makes the task of recognizing what is routine and what is rare one-time event difficult. Even more difficult is identifying events that occur with irregular frequencies. But the benefit is that when the exercise is finished, a person should be able to understand the work process much better. The steps in constructing a list of periodic events are as follows:
Step 7: Suggest Changes, Select One and Do ItA component of Plan, Do, Check and Act (PDCA) is to select a possible solution and implement it, to so called "Do Phase." To find out what should the improvement team implement, it is important to collect ideas from each team member. There should be an organized approach for collecting ideas, listing them and evaluating them. Often people express an idea and evaluate it immediately afterwards. Research shows that brainstorming ideas before evaluating them is more productive: more ideas are expressed and better ideas are expressed. One tool often used for collecting ideas before evaluating them is referred to as a Fishbone diagram. In this tool ideas are listed under different categories. Team members brainstorm major causes that can lead to the problem. Then for each main cause, they brainstorm specific causes. The list of causes of the problem is arranged like the bones of a fish. The x axis ends with the statement of the problem. Additional lines are drawn at 45 degree angle to the x axis for each additional main cause. All the causes are listed along these additional slanted lines. When many lines are drawn the picture looks like a fish bone hence the name fish bone diagram. Figure 1 shows a Fishbone diagram where ideas for why mishaps occur are listed under four categories (training, supervision, material/equipment, and procedures):
Step 8: Check & ActThe last phase of the Plan, Do, Check and Act (PDCA) is to check that changes that have been introduced have actually improved the situation and if not act to implement other changes that could improve the situation. Many act and decide that the improvement will follow. They do not collect data to verify whether they have succeeded. Or if they collect data they may just rely on their own experiences. Often people generalize from one single experience. This is a mistake. For learning to occur, you need to look for patterns across experiences. People often do not do that. In science, we learn from mistakes. We make a hypothesis and then look for data that will prove it wrong. But, in life, we survive by avoiding mistakes. We cannot systematically look forward to making mistakes. We may learn a lot but we may not survive to take advantage of the learning. So we often avoid mistakes. This creates a problem. We are never sure if the experiences we avoided could have led us to other conclusions. Learning from one's experiences is tricky. In this regard, Russo JE, and Schoemaker PJH write in their book on Decision Traps (Doubleday, 1989):
Data is needed to correct our experiences and insights. Data is also needed for communicating the problem and its solution to others. Without data there is no arbitrator among the various ideas. Different professions will claim solutions that in reality do not work to resolve the problem for the customer. In the end, data is the only way that different professions can become focused on the customer's experiences. Gathering data is time consuming. There are short cuts.
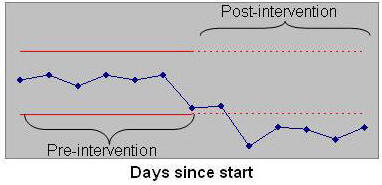
Sometimes, you just have to gather the data so that you can make your case for people outside the team. Many proposals fail to solve the problem at hand. It is important to gather data concerning how the intervention has solved the problem. Such data can be used to alert the team that a successful solution has been found. If the data does not show that the problem has been solved, the team needs to continue examining other solutions. Pilot testing and gathering data on improvement is also useful for helping other employees believe in the team's recommendations. Learning organizations need to allow for testing new ideas, even if these ideas are subsequently discarded. Without trying, that is without accepting that you will occasionally fail, no learning can occur. Teams should decide on the solution they wish to implement. One way to do so is through the Nominal group process. In this process team members silently generate a list of ideas. A group facilitator collects all ideas and lists it for all to see. Then group members rate each idea. The group facilitator collects the ratings and displays the average rating for each idea. Team members then discuss if certain ideas should receive higher ratings. Following the open discussion, team members rate again and the idea with highest ratings is selected. To see if the ideas select actually improve the situation, it is important to implement a pilot test of the idea and collect data on whether the change is an improvement. When data is collected, it is important to examine whether the process performance has changed over time. By examining the process over time, one examines the data before and after the intervention. One way to do so is through control charts. Control charts, especially risk adjusted control charts, are discussed in depth in subsequent lectures. Figure 2 shows an example of a control chart. In this chart data before and after the implementation of a change are displayed. The red lines show upper and lower control limits. Values that fall below or above the control limit signify a change in the process.
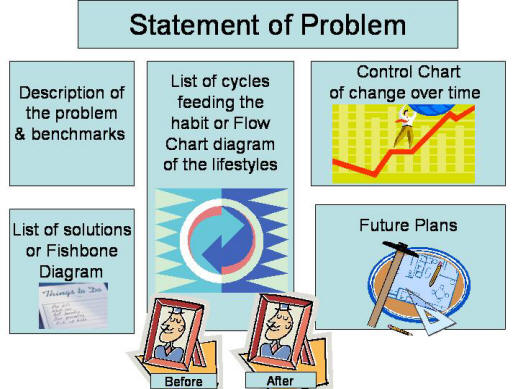
Step 9: Show and Tell and Celebrate SuccessEffective change requires clear communications. When you tell others about your efforts, you become more committed to them. Surprisingly, when you tell others about personal improvement you also get to understand yourself better. How do you tell, is up to you. Some use paper and pencil diaries, others use emails, still others use slides. Whatever you do, keep in mind that successful ideas and efforts will die and disappear if they are not communicated clearly, vividly and using multiple media. The purpose of a story board is to summarize and visually present the impact of the improvement. It serves as a communication medium to others around you. It also serves the project team as a documentation of their progress to date. Story boards is a form of public reporting, there are many other mediums and methods available for reporting on an improvement effort. Story boards is also a celebration of success and in this manner it provides a positive environment for change. Here are brief steps to follow if you are constructing a story board. Divide the story board into the following sections:
To assist you in creating a storyboard we have put together a template using Microsoft Power Point. Download► PPS► Html► Here is a layout of what goes where if the sections were included in one large poster:
Here are simple steps you can take to make your storyboard better:
One way to tell your story is to narrate your presentation. Savvy managers use media to make their points to employees through out the firm. In doing so, they make sure that different employees hear of the process improvement as it progresses. In narrating slides, please keep the following advice in mind:
Many improvement projects fail to create a story board. Or if they do, they create the board only after the fact. This is a mistake and these projects are not taking advantage of an important communication tool. When you make the storyboard on the first day of the project, it begins to tell that something is up. As time goes on, it unfolds a story about what the team is up to. The climax of the story is reached when the control chart is posted showing the improvement. Story boards are the team's public minutes. It helps integrate the rest of the deliberations. Unfortunately, many are not comfortable with taking advantage of mass communication tools, like a storyboard. But real lasting change requires help from others who share the environment. Without the storyboard, others are not aware and cannot contribute to changes in the environment. Step 10: Spread Improvement to Other UnitsWhen an improvement effort has succeeded in one unit of the organization, it is important to spread the improvement to other units. The key in accomplishing this step is to persuade other units to adopt the change by explaining the benefits of the change. But sometimes this is not enough. Some employees may not want to change no matter how much they will benefit from the change. It is important to work on barriers for widespread implementation of the change. Many projects make rational arguments, based on self interest or organization's interest (e.g. if we make this change we can save money). This is not enough. Adoption of improvements across organizations are more likely when the self-interest arguments are supplemented with emotional appeals. Employees are more likely to change when they are reminded about it, feel good about the change, see others that they admire changing and adopting the new ways, and think it will help them do their work with less effort. What do you know?
Please send an email to your instructor with your responses to the above questions. Make sure that the email subject line includes the course number, topic name and your name, otherwise it will not get to the right place. For example, subject line could be: "Joe Smith from HAP 586 responses to questions in lecture on PDCA cycles" If you wish to receive a receipt that the instructor has received your email, you may request the receipt from your email program. Please respond to all of the questions within the same email. Keep a copy of all your emails to the instructor till the end of the semester. Email► Analyze DataTo help you get ready for a number of control chart assignments coming up later in the course, we ask that you become more proficient in using Excel.
Email your instructor and obtain his email. Then send an email to him with your Excel file attached. For full credit of your work, in the subject line include the course number and your name. For example, subject line could be: "Joe Smith from HAP 586 analysis of data in lecture on PDCA cycles" Please submit one file. Please note that all cell values must be calculated using a formula from the data. Do not enter values in any calculated cells. Calculate each cell using Excel formulas. Keep a copy of all assignments till end of semester. Email► PresentationsTo assist you in reviewing the material in this lecture, please see: Narrated lectures require use of Flash. Examples
More
|
|
This page is part of the course on Quality, the lecture on PDCA Cycles. It was last edited on 05/12/2003 by Farrokh Alemi, Ph.D. © Copyright protected.
|