![]()
|
|
|
Supplement to Stratified Covariate Balancing ChapterPresentations
AssignmentsQuestion 1: The following data provide the length of stay of patients seen by Dr. Smith (Variable Dr Smith=1) and his peer group (variable Dr. Smith = 0). Data►
Question 2: The following data provide the survival among cancer patients. The data provides 35 common comorbidities for patients who have or don't have stomach cancer.
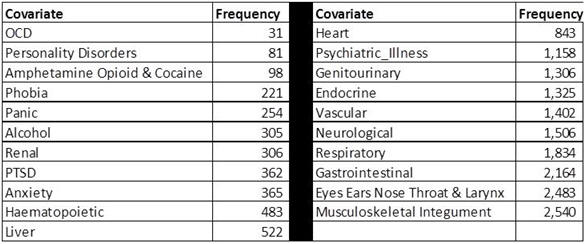
Report how the unconfounded and confounded odds of mortality from stomach cancer are different from each other? Data► Question 3: These data come from STAR*D experiment conducted by National Institute of Medicine. Use instructor's last name as password. Data► Protocol► The data report the experience of approximately 4,000 patients with various antidepressants: citalopram, bupropion, mirzapine, buspirone, lithium, nortriptyline, sertraline, thyroid, tranylclypromine, and venlafaxine. The objective of this analysis is to find which antidepressant is ideal for a male patient who has PTSD, neurological disorders, and endocrine disease but no other comorbidity. The patient does not have the following covariates: risk of suicide, heart, vascular, haematopoietic, eyes ears nose throat larynx, gastrointestinal, renal, genitourinary, musculoskeletal Integument, psychiatric illness, respiratory, liver, alcohol, amphetamine, cannibis use, opioid use, panic, specific phobia, social phobia, OCD, anxiety, borderline personality, dependent personality, antisocial personality, paranoid personality, personality disorder, anorexia, bulimia, and cocaine use. The following table shows the distribution of the covariates in the data.
The data are reported for a total of 22,254 visits. Visits may be 2 week or more apart. Not every patient shows for every scheduled visit. Organize the data so there is one row for each patient and each antidepressant trial (known in the data as Concat). Note that this field considers combination of antidepressants as a new antidepressant. Ignore the dose of the medication. Patients received multiple antidepressants during these trials until something worked for them. Include each time a new antidepressant was tried as a separate trial. If the patient has taken the antidepressant at any time during the trial, then mark it as 1, otherwise 0. Notice that some patients have taken the medication and others have not. Patients who have not taken a particular medication have taken other medications, so at any time we are comparing one medication to alternative treatments. The medication is considered to have caused the remission if the patient is referred to follow up portion of the study, at any point while taking the medication; i.e. the variable "Treatment_plan_equal_3" is set to 1 while taking the medication .
Question 4: The following data have been taken from nurses rounding in a facility. The time they spent with patients has been recorded. In addition, several characteristics of the patients have also been recorded and standardized. Using stratified covariate balancing indicate if any of the nurses have a significant impact on overall satisfaction in the unit? Data► Polly's Teach One► Question 5: In a nursing home, data were collected on residents' survival and disabilities. The data are listed in the following order: ID, age, gender (M for male, F for Female), number of assessments completed on the person, number of days followed, days since first assessment, days to last assessment, unable to eat, unable to transfer, unable to groom, unable to toilet, unable to bathe, unable to walk, unable to dress, unable to bowel, unable to urine, dead (1) or alive (0), and assessment number. Does inability to eat increase probability of mortality in 6 months? Use SQL and stratified covariate balancing to determine if inability to eat contributes to mortality, after controlling for other disabilities of the patient. Data► Question 6: The following data show the variation in diabetes in select counties across United States. Using stratified covariate balancing report the impact of access to supermarkets on diabetes after controlling for other variables. Data►
MoreFor additional information (not part of the required reading), please see the following links:
|
||||||||||||||||||||||||