|
|
|||||||||||||||||||||||||||||||||||||||||||||||||||||||||||||||||||||||||||||||||||||||||||||||||||||||||||||||
Business Value of IT
|
|||||||||||||||||||||||||||||||||||||||||||||||||||||||||||||||||||||||||||||||||||||||||||||||||||||||||||||||
| Year | 1 | 2 | 3 | 4 | 5 |
| Microfilm Equipment | $ 100,000 | ||||
| Microfilm Supplies | $ 15,000 | $ 15,450 | $ 15,914 | $ 16,391 | $ 16,883 |
| Copier Costs | $ 5,000 | $ 5,150 | $ 5,305 | $ 5,464 | $ 5,628 |
| ED Printing Costs | $ 500 | $ 515 | $ 530 | $ 546 | $ 563 |
| HIM ED Postage | $ 7,500 | $ 7,725 | $ 7,957 | $ 8,195 | $ 8,441 |
| Marginal Facility Costs | $ 17,500 | $ 36,050 | $ 54,075 | $ 72,100 | $ 74,263 |
| Auto-indexing | $ 36,000 | $ 37,080 | $ 38,192 | $ 39,338 | $ 40,518 |
| Total Benefits | $ 181,500 | $101,970 | $121,973 | $142,035 | $146,296 |
In implementing an electronic health record, it is claimed that the system will lead to better customer satisfaction through a faster, more user friendly patient registration, and faster access to billing and payment information. How would you measure change in customer satisfaction before and after EHR implementation. How would you put a dollar value on improved satisfaction?
Calculate the return on investment for the data presented in page 45 of Kropf and Scalzi book. Conduct the sensitivity of your conclusions to changes in laboratory savings and time horizon of calculating return on investment. Amazon►
What is wrong with the traditional methods of evaluating return on investment in EHR. How does the causal calculation of return on investment overcome the shortfalls of these traditional approaches?
What three pieces of information needed to establish a more causal relationship between investment in technology and its return? Think of a specific organization and describe where can you find these three pieces of data.
Does correlation establish causality and if not what additional information is needed so that a more causal analysis is done?
What is the present value of $10,000 income for the next 5 years if the current rate of interest is 6% per year?
Plot a chart showing the relationship between Investment in IT and revenues
using the data in Table 1.
| Academic year | Revenue (in 1000s) | IT investment (in 1000s) |
| 97-98 | $107,263 | $9,770 |
| 98-99 | $117,197 | $11,363 |
| 99-00 | $126,091 | $15,572 |
| 00-01 | $132,811 | $17,312 |
| 01-02 | $137,656 | $15,099 |
|
Table 1: University Revenue & Investment in Online Teaching |
||
Compare your work with results in Figure 1.
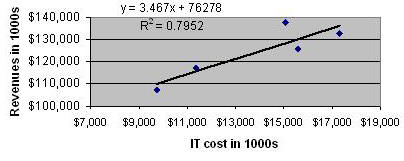
Figure 1: Investment in Online Teaching and University Revenue
Calculate the present value of IT investment for the data in Table 1. Assume a 6% return on investment.
Calculate the correlation between IT investment and Revenue in Table 1.
Do One Assignment: ROI
on an IT Project
Adult learners understand a topic best by doing it. It gives them
both new skills and confidence in their ability to carryout the
recommended procedures. In this project, you will estimate the
relative value of VistA for the Veterans Administration. In order
to make sure that the project can be done in a short time interval, no
data collection is necessary. All needed data will be provided by
the instructor in response to your queries.
-
In August 20, 2007 we asked the Department of Veterans Affairs to provide us two pieces of information under the Freedom of Information Act. We asked them for the budget of the Office of Information in the last decade (this office was recently organized and the FOIA officer had to estimate what the budget of the office would have been prior to the re-organization). We also asked for the number of patient records in VistA database. On October 16th 2007 they provided us with the following information:
Fiscal Year Budget of Office
of InformationNumber of
Records in VistAVHA Cost per Patient Index 2004 533,190,714 4,976,773 0.8%
2003 316,467,395 4,806,871 -4.6% 2002 245,998,730 4,545,559 -9.1% 2001 187,087,714 4,088,075 -7.3% 2000 171,353,392 3,673,612 -6.5% 1999 203,211,123 3,425,474 -8.6% 1998 199,997,062 3,273,020 -6.2% Table 2: Investment in IT, Use of VistA and Cost per Patient Index
-
Calculate the correlations between (a) index on cost of care per patient, (b) number of records in VistA system and the budget of the office of information.
-
Provide scatter diagram showing the relationship between IT investment (budget of Office of Information) and cost of care (VHA cost per Patient Index)?
-
What came first, IT investment or changes in cost of care? How►
Here are some recent student works. Please do not assume that these are error free or exemplary work as the content of the assignment has changed over time: Karen►
More
- Cost and benefits of electronic health records Read►
- Introduction to causal networks by Pearl Read►
- Tutorial on how to justify cost of IT Read►
- Impact of economics on changing medical technology with reference to critical care medicine in the United States PubMed► Listen►
- How to use an article evaluating the clinical impact of a computer based clinical decision support system. Pubmed►
- Evaluation of computerized clinical charts PubMed►
- Performance of four computer-based diagnostic systems.
- Exploring the EMR cost benefits analysis: Managing ROI into reality Slides►
- The value of electronic health records in solo practices Read►
- A cost-benefit analysis of Electronic Medical Records in primary care Read►
- Measuring the impact of new technology: an outcomes-based approach. PubMed► Slides►
- Medical technology assessment Wikipedia►
- The Costs of a National Health Information Network. PubMed►
- Cost-effectiveness prospects of picture archiving and communication systems (PACS). Search►
This page is part of the course on Information Systems. This page was edited 06/11/2007 by Farrokh Alemi, Ph.D.. ©Copyright protected.