HAP 719 Advanced Statistics

HAP 719: Advanced Statistics I

Ordinary Regression  


Overview

Read Chapter 11 in Statistical Analysis of Electronic Health Records by Farrokh Alemi, 2020 Slides► YouTube► Video►

Learning Objectives

After completing the activities this module you should be able to:

  • Clean data
  • Estimate missing values
  • Fit different types of models to data
  • Interpret findings from statistical outputs pertaining to a regression model building technique

Assignments

Assignments should be submitted in Blackboard. The submission must have a summary statement, with one statement per question. All assignments should be done in R if possible.

Question 1: The attached data show the percent of diabetes in different 2,228 counties within United States in 2010, 2011, and 2012 years. We want to understand if access to food stores affects diabetes. Regress incidence of diabetes in 2012 on 2011 and 2010 variables. 

Network Model of food access and diabetes
  1. Test assumptions of regression
  2. Print out the coefficients of the regression.
  3. What percent of variation of diabetes is explained?
  4. List variables that take at least 2 years before they have a significant effect on diabetes
  5. List variables that can affect diabetes in 1 year

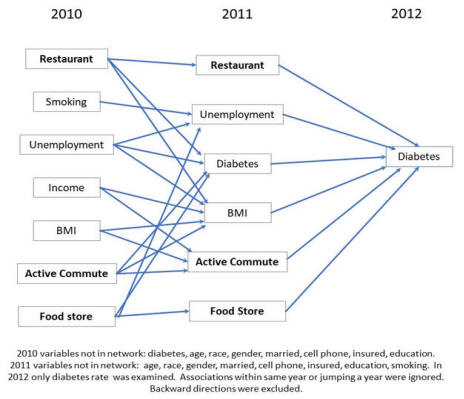
Resources for Question 1:

Question 2: A cross-sectional study was conducted to examine depression in a sample of male, elderly subjects residing in a senior living community. Depression was measured by a depression score. Several independent variables were included in the analyses such as sociodemographic, psychological and physical health related measures as well as social support. All of the variables (dependent and independent) are continuous. Using the results of this analysis, answer the following:

  1. State a possible research question (hypothesis and null hypothesis) based on the results shown.
  2. What statistical method was used to analyze the data based on the results shown and why?
  3. State any statistical assumptions associated with the statistical method used in the analysis.
  4. What can you conclude about the overall significance of the model?
  5. Provide an interpretation of the adjusted R square value?
  6. Provide an interpretation of the statistically significant findings (at an alpha value=0.05).
  7. Describe potential study implications for elderly individuals who reside in senior living communities based on the study results.

Resources for Question 2:

More

For additional information (not part of the required reading), please see the following links:

  1. Introduction to regression by others YouTube► Slides►
  2. Regression using R Read►
  3. Statistical learning with R Read►
  4. Open introduction to statistics Read►

This page is part of the HAP 819 course on Advance Statistics and was organized by Farrokh Alemi PhD Home►  Email►