 |
|
| |||||||||||||||||||||||||||||||||||||||||||||||||||||||


| Number Recovering (Number Taking Medication) | ||
| Med | No Med | |
| Men | 81 (n=87) | 234 (n=270) |
| Women | 192 (n=263) | 55 (n=80) |
| Total | 273 (n=350) | 289 (350) |
Resources available for Question 1:
- Answer to part d is on page 57 of the "Causal Inferences in Statistics: A premier" book. Read►
Question 2: Organize the data from the previous question into a Netica model, with tables completed. Show how a do operation can be calculated using the Netica software.
Resources for Question 2:
Optional Question 3: Calculate the causal impact of fever on diagnosis of COVID, using do operation:
Resources for Question 3:
- Network for diagnosis of COVID from in-home symptoms Zipped Netica►
- Removing selection bias in impact of fever Excel►
Question 4: The following data show the joint distribution of gender, medication taken, and response to the medication (similar to question 1). Keep mind that the conditional probability of taking the medication given the patient's gender is also called propensity score. Conditional probability of x given z is calculated as the joint probability of x and z divided by probability of z.
- Calculate the propensity of clinician prescribing the medication for each recommendation of AI system.
- Calculate the un-confounded impact of clinician's prescription patterns, using inverse propensity scores
- Calculate the impact of the AI system on remission of patients' symptoms. To do this, sum the product of probability of remission given AI advice times probability of AI's advice.
| Joint Probability | |||
| X, Clinician's Prescription | Y, Patient's Remission | Z, Artificial Intelligence Advice | Probability |
| Med A | Yes | Med A | 0.116 |
| Med A | Yes | Other Med | 0.274 |
| Med A | No | Med A | 0.010 |
| Med A | No | Other Med | 0.101 |
| Other Med | Yes | Med A | 0.334 |
| Other Med | Yes | Other Med | 0.079 |
| Other Med | No | Med A | 0.051 |
| Other Med | No | Other Med | 0.036 |
Resources for Question 4:
- Answer to part b is on page 72-75 in the book "Causal Inferences in Statistics: A premier" book. Read►
Optional Question 5: An adjustment set is a set that allows you to calculate causal impact of exposure/treatment. There are several different ways of identifying an adjustment set. If all parents in the Markov Blanket of exposure are stratified, then the causal effect of exposure on outcome can be measured. This, however, may not be the minimal set. In this problem, you are asked to use to identify the minimal adjustment set for the following graph:

Resources available for answering Question 5
- Tool for determining minimum adjustment set Web►
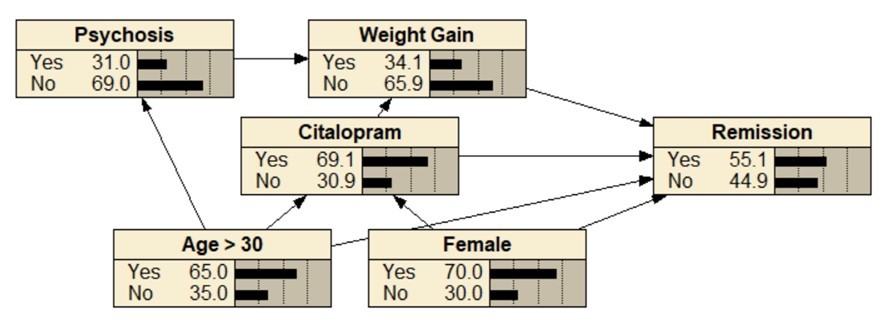
Question 6: Calculate the average treatment effect and the causal impact of citalopram on remission of depression symptoms, using the attached network. Why are these two values different?
Resources for Question 6:
- Zipped Netica file for the network Zip►
- Surya Venkatesan's Intelligent Tutor Word► (Copy paste the entire document into an AI platform)
- Calculation of causal and average treatment effects Video►
- Yili Lin's Intelligent Tutor Patriot AI►
Question 7 (semester long project): Create a knowledgebase to support your planned decision aid using patient-level data. A patient-level database contains individual patients’ features and outcomes of interest. A knowledgebase summarizes relationships between pairs of variables across patients, rather than retaining individual patient records. This aggregation reduces the disclosure of patient information, and automatically guarantees de-identification. Complete the following steps:
- Design the knowledgebase. Specify its structure, including how each pair of variables and the measures describing their relationship will be stored. This should include a 2 by 2 contingency table relating any pair of variables and a temporal order of the pair of variables.
- Use AI to generate the code. Provide an AI system with your proposed knowledgebase structure and an appropriately de-identified or synthetic version of the patient-level data. Ask it to write code that constructs the knowledgebase.
- Execute the code. Review the generated code, make any necessary corrections, and run it.
- Validate the results. Compare selected knowledgebase entries with hand calculations from the original patient-level data to confirm that the relationships are represented correctly.
Submit the first four rows of your knowledgebase structure, the prompts used with the AI system, the code, and a brief description of your validation checks and findings.
Resources for question 7
- See the procedures for COVID-19 data More►
- Use data collected from real patients Download► Dictionary►
- Create the knowledgebase of the AI system from the data CSV►
More
For additional information (not part of the required reading), please see the following links:
- Graphical models and measurement of counterfactuals Read►
This page is part of the course on Comparative Effectiveness by Farrokh Alemi, Ph.D. Course Home► Email►