 |
||||||||||||||||||||||||||||||||||||||||||||||||||||||||||||||||||||||
|
||||||||||||||||||||||||||||||||||||||||||||||||||||||||||||||||||||||
Import, export data tables across platforms
Structure queries to describe complex relationships between fields in healthcare databases.
Databases contain a great deal of information in separate tables. An analyst is often called upon to integrate these separate tables, to find answers to specific questions. This process is called querying a database. In this lecture, you learn how to query a database. Standard Query Language (SQL) is the list of commands that can be used to query a database. An example is provided in Figure 1. This list of commands is widely available and many different databases use the same SQL commands. In order to help people query a database without knowing SQL, some Databases, such as Microsoft Access, have created graphical interfaces. This lecture is about Microsoft Access graphical interface for querying a database. A later section teaches the use of SQL.
This lecture corresponds to pages 192 through 226 in assigned required book titled “Teaching yourself Visually Access 2003.” During this presentation, you learn by doing. Each concept is demonstrated by showing you how it is done in Access database. In this sense, this session is more of a laboratory for you than an actual didactic lecture. Do not expect to master this section without actually repeating everything demonstrated here on your own inside a database. Keep in mind that practice makes perfect.
| SELECT Claims.PatientID, Last(ICD9.ICDDescription) AS LastOfICDDescription FROM Claims INNER JOIN ICD9 ON Claims.DiagnosisCode = ICD9.ICD9Codes WHERE (((ICD9.ICDDescription) Like "*diabete*")) GROUP BY Claims.PatientID ORDER BY Claims.PatientID; |
| Figure 1: Example of Standard Query Language |
Figure 2 shows the Microsoft Access’s view for designing a query. This query window replaces SQL commands. You find the query design window by opening a database and selecting the option to design a query.
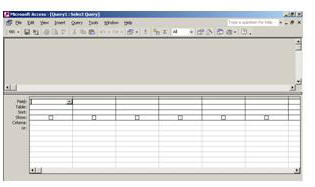
Figure 2: A Graphical View for Designing a Query
The top part is called the toolbar. There are many database options here. Two rows of options are shown in Figure 2. One row in text and another in graphical icons. The first row is focused on database options, like opening a database. The second row shows the query toolbar, displayed here in graphical icons. On the left lower corner you see a button that allows you to see various views of a query. For example, you can see an SQL view of the query. You can go back and forth between the graphical and SQL view of the query by clicking on the View button in lower left toolbar. Next to the View icon, you see the icon for saving the changes you have made to query. To the right of save icon, you see the option to search as well as a series of typical options available in any software such as print, copy, cut, paste, undo and redo. To the right of redo you see the option of setting type of query and next to it the exclamation mark is for running a query. Once you have set up your query, you can use this option to run the query and get your results. Next to run icon, you see the button for showing tables on which the query is run. Obviously you must specify which of the many tables in your database are involved in the query. To the right, you see the Total button shown as a summation sign. This sets the option for summarizing several rows of data into one row, for example, when you sum the data in several rows to show as one value. To the right of the total button, you see a command to restrict how much of the output of the query should be displayed. For example, if you want only the first few rows of the query results displayed, you can do so using this option. Still further to the right is the option query properties, for example, here you can specify that values used should be unique and non-duplicating. Still to the right of this you see a wand. This allows you to use internal Access functions to calculate a new field from existing fields in the tables. To the right of the wand you see the option to return to the database view, so you can go back and forth between query window and database window. To the right of this feature you see the new object icon, where you can automatically generate reports from a query that you have created.
Right below the toolbars in Figure 2, you see an area where the tables involved in the query and their relationships can be displayed. You might use this area to specify several tables and set the keys that these tables share with each other. Obviously, only fields within the tables you set inside the query are available for display in the result section of a query. If your database has many databases, this is one way of focusing on a small subset of tables. At the bottom of Figure 2, you can see the space for entering the various fields to be displayed in the result of the query. Some of these fields may come from different existing tables. Others may be calculated. For each field listed we need to specify where it comes from. If it comes from a table, in the second row we specify the table. We can also specify whether the field should be used to sort the data in the query display. This is done in the third row. In the fourth row we have the option of showing the field or hiding it from the display. The last two rows are for criteria that can be used for filtering the field. When a criterion is set, the query will only display the records that meet the criterion.
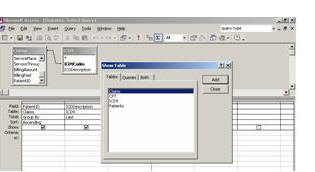
Figure 3: Including Relevant Tables in the Query
The first step in constructing a query is to include all relevant tables (see Figure 3). If a field is used in a query, a table containing the field must be included in the query. This is done through show table icon, which opens a list of queries and tables that one can include. If more than one table is included, one must also specify the relationship between the tables or queries. Please note that a query can have as input another query so one can build multi-step filters of the database tables. The relationship between the tables is specified by dragging one field from one table on top of another field in another table. Access shows the relationship between two tables by creating a line from a field in one table to a field in another table. When a relationships is created between two tables, it is like the tables are joined together to make a larger table. Records in this larger table are arranged so that the two fields dragged on each other have the same values. For example, one could use patient’s ID in the claims table to join it to the primary key of the patient’s table. Or one could use the diagnosis code in the claims table to a table describing the code.
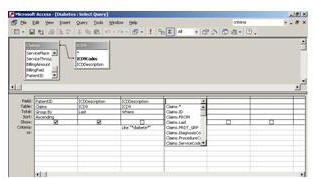
Figure 4: Including Appropriate Fields in Query Design
In a query you need to specify what fields should be included in the resulting data. This is done by entering a field name in the field row in the lower part of query design window (See Figure 4). Fields can be included from all joined tables. In this fashion, a select query makes information in various tables available in one setting. Fields can be dragged from the shown tables to the field cell or one can click on the right of field cell and select a field.
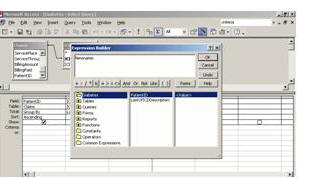
Figure 5: Computing a New Field
A new field can be calculated from one or more fields in the joined tables or queries. The easiest way for doing so is to put the cursor into the cell for fields, then click on the expression builder icon, the wand. A new window opens called Expression Builder window (See Figure 5), This window allows you to type the name of the new field followed by colon and followed by the expression to be used to calculate the field. The new name should not contain space or if it does have space it should be put inside brackets. The expression could be composed of built in functions available in Access. Under functions, you will see many examples of existing built in function. The most commonly used function is iif, which allows one to assign a value if a test is met and otherwise assign a different value. There are also numerous functions for dates, the most used one is for calculating difference between two dates.
Here is an example of an expression for computing a new field called Diagnosis:
Diagnosis: iif(ICD9!Description like “*diabetes*”, “Diabetes”, “Other)
In English this expression says the following: If the field Description in the table ICD9 contains the word diabetes assign to the field diagnosis the value “Diabetes” otherwise assign to the field diagnosis the value “Other.”
Here is another expression:
DayTillNow: Date()-Claims!Date
This expression says: set the field DaysTillNow to be equal to the number of days of difference between today and the field called Date in the table called Claims. The expression Date() is a built in function of Microsoft Access that provides today's date.
There are six different types of queries allowed in Access:
The option to change a query type is available on the query toolbar and can be reached by right clicking on the show tables area.
A select query filters the data by using one or more criteria. In the select query, the records or rows in a table are reduced to the rows that meet a set of criteria. For example, we might have a table of claims and want to restrict it to patients who had a claim of influenza. Select query restricts the content by criteria that a field should meet before it is allowed to be included in the display.
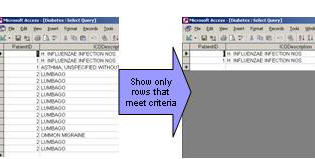
Figure 6: A select query displays records that match the pre-specified criteria
Microsoft Access also allows several other methods for selecting a subset of a table. One way is to restrict the cases by matching a field in another table. This is typically done when setting the relationship among tables. First, you need to show the tables that are used in the query using the show table icon. Once the tables have been added to the show table area of the query, then you can set the relationship among the table by setting different types of joins. There are three different joins.
For example, one might have a table claims that contains diagnosis codes. The meaning of these diagnostic codes might be available in a separate table called diagnosis codes. A join can select the text for the diagnostic code and combine it with the claim data. A one-to-one join will lead to listing of all claims in which the diagnostic code has a corresponding text in diagnosis table. In a one-to-one join, if the description of the diagnosis code is missing in the diagnosis code table, then all corresponding claims will not show. In contrast, in a one to many join, we can display all claims and their corresponding text for diagnosis; where the diagnosis text is missing in the diagnosis code table, a missing value is entered.
You can specify criteria for a field by entering an expression in the criteria cell for that field. An expression calculates a single value from a combination of fields using mathematical operations, word operations, or logical tests. For example, the following is an expression that can be entered in the criteria row under the field called ICDdescription:
like "*diabete*"
In this expression, the field ICDdescription is restricted by the criterion that it should contain the word diabetes. "Like" is one of the built in functions available through Access. The like function is followed by quotes that contain star or question mark. A star means any number of letters and question mark means 1 additional letter. A star before and after a word means that any word can follow or precede the target word. In here, a sentence such as "diabetes mellitus" is matched because it contains the word "diabete" and is followed by other text. The sentence "Severe Diabetes" is also matched because text precedes diabetes. None of these two sentences are exact match to the word "diabete" as they contain other text. If we had asked for an exact match there would have been zero records selected. To set up a criterion, you put your cursor inside the cell and click on the expression builder icon, the wand. You can now use any combination of field names from tables and queries that have been included in the query. There are a number of built in functions available. These include the function iif for testing an expression and various functions for dates.
Here are some examples: The expression >120 means greater than 120. The expression > 6/12/05 means passed June 12th 2005. The expression Not “*ism” means not any text ending with the word suffix ism. The expression <Date() means before today’s date. The expression Is Null means that there are no data in the field. The expression Not Diabetes means not matching exactly to the word diabetes, with first letter in of the word diabetes in capital. The expression Like "dia*" matches any text that starts with dia, such as diabetes, dialog, diagram and so on. The expression Between A and D matches any text starting with A, B and C.
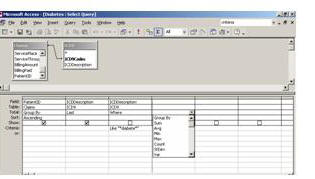
Figure 7: Summarizing Several Records
You can summarizes several records into one value by using built in functions such as:
The summary row, called Total, is added to a query by selecting the icon that looks like a summation sign. When you do so, a row is added to the fields area called “total”. In this row you have to select which of the many features you want to use. For example, by entering "Group By" under the field for Patient ID, the records are grouped by patient ID. If under the field ICDDiagnosis you also enter "last" in the total row, then the last diagnosis listed in the group is selected. In this fashion you can find the last diagnosis for each patient.
If you need to select a subset of the query, you can use the function "Where" in the total row. You can set "Where" in the total row under ICDDescription field. In a "Where" function, only grouped records matching the criterion under the where field are included in the query. Often when the "Where" function is used, the field is entered twice in the query because the "Where" function cannot be displayed in the query. The second entry of the field is used to display the field. Please note that the "Where" function is executed before the "Group by" function is executed. Thus if a patient has three diagnosis, two of which are diabetes related and one of which is not, the "Group by" function will select 3 records without the "Where" function and select 2 records with the "Where" function.
Once you have organized your query you can select the exclamation icon to run the query. You can also run a query by selecting from the view option at the lower left corner of the toolbar the tabular view of the query.
Besides the select query there are also other types of queries. Crosstab query creates a table view of the two fields in the query. Action queries make a table, delete selected records, or append selected records to a table.
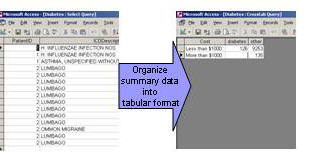
Figure 8: Effect of Crosstab query
A Crosstab query takes the data from different columns of the table and organizes a summary of them into a new table. In the example in Figure 8, the billing data is broken into two groups, less than one thousand and more than one thousand. The diagnosis are broken into diabetes and other diseases, The new table counts the number of patients that fall into every cell.
A Crosstab query allows us to classify records based on content of two fields. To start with, each field should be summarized using group by command. You can create a Crosstab by deciding which field will be the row heading, which field you want to be the column heading and which field do you want to summarize in the cells inside the Crosstab table you are producing. Again keep in mind that you should use a function to summarize the content of records picked up for the cell values. For example, you can select as row headings the gender of the patients and as column headings their age calculated in decades. For the cell content you may select count of records. Thus, you will have a count of patients in each cell. Keep in mind that only one field can be used for column heading while several fields can be used for row headings.
You can change the display of query results in several ways. You can sort the display by using the sort row in the lower part of the query design window. You can also select a field by clicking on the bar right above it and drag it to a different position in order to change the order of fields being displayed. Finally you can rename a field by typing before its name a new name followed by colon. You can change the number of decimals displayed in a calculated field by using the Round function in the calculation. But you cannot change how numbers or dates are displayed in the query without change their format in the original table.
Until now we have been discussing the ideas behind the graphical interface for design of query. No one can learn much by reading these concepts. You can only learn by seeing examples of queries and then practicing on your own. We have put together several videos to help you see how this is done. The following topics are covered in these videos:
Before you can start learning about queries, you need to create a database and fill it with data. In order to do so, please download the following four files and important them into the corresponding Tables:
| File name | Import to Table |
| ptid.xls | Patients |
| claims.xls | Claims |
| icd.xls | ICD9 |
| cpt.xls | CPT |
When you download the files, keep them somewhere you can easily remember as you will need access to the above four files to set up the database used in this lecture. During conversion of these data into corresponding tables, please change the field names to more descriptive names:
| Table name | Name of field before | New field name |
| Patients | PTID | PatientID |
| PAT_SEX | PatientSex | |
| DOE | DateOfEmergency | |
| Claims | SVC_FROM | From |
| LST_ACTV | Last | |
| PTID | PatientID | |
| PRDT_GRP | PRDT_GRP | |
| DIGNSS_C | DiagnosisCode | |
| PRCDR_CD | ProcedureCode | |
| SVC_CDE | ServiceCode | |
| SVC_PLC | ServicePlace | |
| SVC_THRU | Through | |
| BLLD_AMT | BilledAmount | |
| BCC_PAID | BillPaid | |
| ICD9 | ICD | ICD9 |
| ICD_Desc | ICD9Description | |
| CPT | CPT | CPT |
| CPT_Desc | CPTDescription |
During importing a database, you need to set primary keys for each table. Any non-duplicating field can be a primary key. If there are no fields that can be set as primary key, you can allow access to set an auto-number as primary key.
In some situations, you have to compare a field value against the value of the same field in different records. One way of doing so is to copy the table twice and compare the values of the field to the copy of the field. A situation like this arises when we want to find duplicates in a field. First a copy of the table is created and cases where the IDs do not match but the fields do are identified. These are cases with duplicates.
There are three several presentations for this lecture:
Narrated slides and videos require Flash. Download►
Advanced learners like you, often need different ways of understanding a topic. Reading is just one way of understanding. Another way is through doing and practicing the concepts learned in this section. The following assessment is designed to get you to think more about the concepts taught in this session.
Please bring your work to class and show it to your instructor during class time. Alternatively, email screen captures to your instructor. See an example done by Rhonda. More►