|
|
Assigned Reading
Presentations
- Analyze heart rate while controlling for physical activity
Slides► (Coming soon)
Assignments
Instruction for Submission of Assignments: Assignments
should be submitted directly on Blackboard. In rare situations
assignments can be sent directly by email to the instructor. Submission
should follow these rules:
- Include a summary sheet/page and compare your answers to answers
posted
Question 1: Watch data include both heart rates and exercise
level. Unfortunately heart data is not always accurate as exercise levels affect
heart rate measures and interfere with the ability of the watch to alert for
unusual watch rates. Use a risk adjusted control chart to analyze heart rate.
Compare observed heart rate to heart rate expected from exercise.
This analysis requires the following steps:
- Data: Download and merge data from a watch, or use data available here. Steps to download data from a watch are
available on the web.
- Data Frame: Merge the data into one data frame.
Plot the time series.
- Analysis Time: Select a timeframe for developing regression model (e.g., last week excluding yesterday) and a
later timeframe (e.g., yesterday) for testing accuracy of the model.
- Observations per Unit of Analysis: Decide what type of control chart you plan to create by deciding unit of analysis.
If you are looking at multiple observations per time period then risk-adjusted XBar chart is appropriate. If you are looking at 1
observation per time period then Tukey chart done on expected values is appropriate.
- Expected Heart Rate Values: Regress heart rate on calorie consumption, steps, respiratory rate, body motion (e.g.,
sedentary .vs. active) and other available variables.
- Verify that heart rate has a normal distribution by creating a histogram of the heart rate data. If data is not normal come
up with transformations of the data that will make the data more normal.
- Report the R-square of the regression. If low or moderate, include
pairwise and triple-way interaction terms in the analysis.
- Calculate expected heart rate
- Create Control Chart: Create a control chart.
If you have multiple observations for each unit of time, then you should use risk-adjusted control chart. If you have a single observation
per time period then use Tukey chart. If the number of observations in each time period is not constant, then control limits
should not be a straight line and should change based on number of observations. In reporting the control chart, include information
on type of chart, parameters of the control chart and provide the chart.
Here are some resources that might be useful. Please note that some student reports may not be complete.
- Risk Adjusted X-bar chart (difference of expected and observed
values) Slides►
YouTube►
Excel►
Video►
Transcript►
- You can use Tukey control limits derived from expected values.
Here is more on Tukey control limits
Slides►
YouTube►
Video►
- Data1►
Data 2►
Data 3►
- Sample Apple watch data
Excel 1►
Excel 2►
- November data Heart rate►
Energy expenditure►
Combined Access Data►
- Silas Mensah's Teach One
Slides►
- Sai Sumanth Sriram's Teach One. In this analysis,
Heart Rate was predicted as a function of three other variables,
using the formula: HR ~ 78.60 + 0.032 X1 + 0.002 X2 + 0.003 X3. A
risk adjusted X-Bar chart was done with the unit of analysis being 1
hour. All observed and expected heart rate were compared
during the hour and a deviation estimated from the difference of
observed and expected values. On average 10-18 observations
fall into an hour of watch data.
YouTube►
- Venkata Vamsi Patibandla's Teach One
Slides & Code►
- Anudeep Vurity's Teach One Slides & Code►
- Patricia Tran's Teach One using Tukey control chart derived from
expected heart rate values
Code►
Explanation►
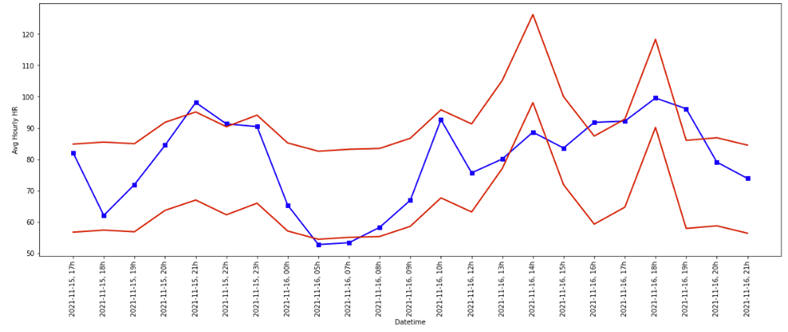
In the following chart of heart rate on September 30th 2022, heart rate is
high at start of the day, drops in middle, and increases towards the end of
the day. The increase in the end of the day is within expectation, as heart
rate for the most part remains within expected heart rate limits. This
chart was created using risk adjusted XBar procedures
More
- Accuracy of smart phone measures
PubMed►
|