Overview
- Transformations
- Regression assumptions and transformations
Review►
- Quntile Transformation
PubMed►
- Adjustments for missing values
- Regressions with rare independent variables
PubMed►
- Construction of new features
- Use of ontology
in feature construction
Read►
- SNOMED CT database
Download►
- SNOMED CT codes for social determinants of diseases
Bard►
- Example of feature construction in lung cancer patients (use instructor's last name as password)
Read►
Learning Objectives
In this session, we review some of the traditional methods of adjusting regressions and then pose additional questions about improving accuracy of
regression model fitting. For some of these questions, we do not have a reasonable answer and therefore this session is more speculative than
other sessions in the class. After completing the activities this module you should be able to:
- Adjust for missing values in the dependent and independent data
- Reason through patterns of missing values
- Include redundant variables in regression
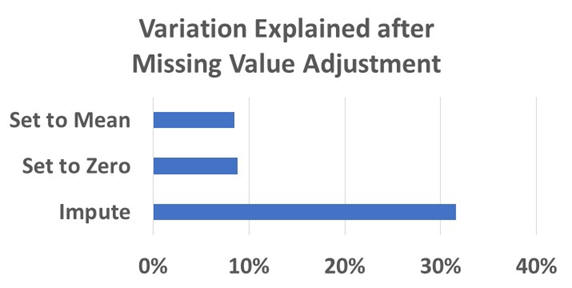
Adjustments for Missing Values
Several approaches are available for replacing missing values so that a complete matrix format of the data (without any variable missing
information) can be accomplished. None of the existing approaches
work when there is extensive non-random missing values.
Assignments
Assignments should be submitted in Blackboard. The submission must have a summary statement, with one statement per question. All
assignments should be done in R if possible.
Question 1 Demo of Reasoning through Patterns of Missing Values: Regress incidence of diabetes on all
other variables indicating progression of diseases in body systems. You can do the analysis first on 10% sample before you do it on the entire data that
may take several hours.
- Remove all instances where incidence of diabetes is not known. Report the number of cases that remain.
- For each independent variable, define an indicator that is 1 when
the variable is missing and 0 otherwise. Set the independent
variable to 0, if it is missing.
- LASSO Regress diabetes on all independent variables, pair of independent variables, and triplet independent variables. Report
the McFadden R-square and the coefficients for the variables.
- LASSO Regress diabetes on all indicators of missing variables, pair of indicators, and triplet of indicators. Report the McFadden
R-square and the coefficients for the variables.
- Regress diabetes on both all independent variables, indicators of missingness, and pairwise and triple combination of these variables.
Report the McFadden R-squared.
Question 2 Demo of How to Include Redundant Variables: We generated 1000 data points for repeated orthagonal factorial combination of 3 variables. We set the
response variable to be the same as the three-way interaction among these 3 independent variables.
- Regress Y on the independent variables with and without the rare
variables. What is the meaning of the error messages?
- What conclusion can you reach regarding the effectiveness of rare
variables?
- What conclusion can you reach about rare variable combinations
that corresponding exactly to positive Y values?
Question 3 Demo of Constructing Features: Body system
are broader codes within SNOMED, they contain diseases. Use the
body system ontology to create a new feature within All of Us database.
The steps include:
- For the "Breast and Endocrine Structures" body system create a feature that
scores the worse diagnosis within this body system. Here is a
list of all body systems within SNOMED CT and their associated code.
|
Body system |
Breast and endocrine structures
|
|
|
|
|
|
|
|
|
Integumentary system structure
|
Lung and mediastinal structures
|
Lymphatic system structure
|
Lymphoreticular structure
|
Musculoskeletal structure
|
|
|
Respiratory and intrathoracic structures
|
Structure of hematological system
|
Structure of skin and/or mucous membrane
|
Structure of skin and/or surface epithelium
|
Structure of special senses organ system
|
|
|
|
Social determinants of diseases
See Bard |
- Identify diseases that are part of "Breast and Endocrine
Structures". You can do this using Bard, but make sure that you
insist it provides a complete list. I have done so and posted it
below. Create a binary variable for each disease, where if the
patient has the disease they have a code of 1 and 0 otherwise.
Excel►
- Regress your cancer on the members of this body system. Estimate the coefficients associated with these diseases. In
this regression you do not need any other variable besides these diseases. You do not need to include combination of diseases.
Your cancer is the response variable. The independent variables are binary variables, one for each one of these diseases. The
relationshp between coefficients of a logistic regression and odds ratio of the response variable are described in the following
document.
Read►
- Create a new variable in All of Us database called "Worst of
Breast and Endocrine Structures Body System" or "Worst of Endocrine", where the patient is assigned the exponential of the
variable with the highest coefficient.
More
For additional information (not part of the required reading), please see the following links:
- Open introduction to statistics
Read►
This page is part of the HAP 819 course on Advance Statistics and was
organized by Farrokh Alemi PhD Home►
Email►
|

