|
| ||||||||||||||||||||||||||||||||||||||||||||||||||||
| Number of Patients Recovering | ||
| Advice Followed | Advice Not Followed | |
| Men | 81 (n=87) | 234 (n=270) |
| Women | 192 (n=263) | 55 (n=80) |
| Total | 273 (n=350) | 289 (350) |
Resources for Addressing Question 1:
- Download and copy paste the content of this document into a Large Language Model. Intelligent Tutor►
- Yili Lin's intelligent tutor Patriot AI►
Question 2: Calculate the following probabilities using the data in the following Table
- Probability of being 18 to 29 years old
- Probability of being 30 to 40 years old given that you are at least 29 years old
- Expected value of age
| Age Group | # of voters |
| 18-29 | 20,539 |
| 30-44 | 30,756 |
| 45-64 | 52,013 |
| 65+ | 29,641 |
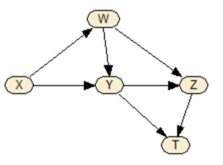
Question 3: Using the following graph, answer the following questions:
- Name variables that temporally precede Z. Use the direction of the arc to set precedence.
- Name variables that are not correlated with Z. Note that in a network, all connected variables are correlated.
- Name all of the parents of Z. Parents precede Z and directly affect Z.
- Name all of the ancestors of Z. Ancestors precede Z but indirectly affect Z through other nodes.
- Name all of the children of W. This is all nodes in which W is a parent of the node. Children follow W and are directly affected by W.
- Name all of the descendants of W. Descendants follow W but indirectly are affected.
- Identify all simple paths between X and T, where no node appears more than once.
- Draw all direct paths between X and T. This includes all arcs where X is start and T is end of the arc.
- What is the definition of a directed a-cyclical graph (DAG), and is this graph a DAG?
- What is the common cause of Y and Z? Common cause is a parent shared between Y and Z.
Question 4: Draw networks based on the following independence assumptions. When directed networks are possible, give formulas for predicting the last variable in the networks from marginal and pair-wise conditional probabilities. Keep in mind that absence of independence assumption implies dependence. In the following, the function I(X,Y) indicates that X is independent of Y. The function I({X,Y}|Z) implies that the joint variable X and Y are independent of Z. This implies that each variable is independent of Z. If each variable is independent of Z, this is not sufficient to say the joint distribution of X and Y are independent of Z.
Resources for Question 4:
| Nodes in Network | Assumption |
| X, Y, Z | I(X,Y) |
| X, Y, Z | I(X,Y), Not I(X,Y|Z) |
| X, Y, Z | I(X,Y), I(X,Y|Z), Y measured last |
| X, Y, Z, W | I(X,Y), I(X,Y|Z), I({X,Y},W|Z), W measured last |
| X, Y, Z, W | II(X,Y), I(Z,W), and X measured before Z and Y measured before W |
Optional Question 5: This problem comes from study question 1.3.2 in Causal Inference in Statistics. Using the proportion of male and females achieving a given level of education, calculate the following probabilities:
- Estimate p(High School)
- Estimate p(High School OR Female)
- Estimate p(High School | Female)
- Estimate p(Female| High School)
| Education | Male | Female |
| Never Finished High School | 112 | 136 |
| High School | 231 | 189 |
| College | 595 | 763 |
| Graduate School | 242 | 172 |
More
For additional information (not part of the required reading), please see the following links:
- Introduction to causal inference Read 1► Read 2► Video► Slides►
- Meta analysis through Bayesian networks Read►
- Introduction to Bayesian networks Read►
- Learning Bayesian Networks Read►
- Selection of Judea Pearl's articles PubMed►
- Applications of Bayesian networks in healthcare PubMed►
- Bayesian networks in neuroscience Read►
- Cost analysis using Bayesian networks Read►
- Bayesian network classifiers Read►
This page is part of the course on Comparative Effectiveness by Farrokh Alemi, Ph.D. Course Home► Email►