Assigned Reading
Assignment
Include in the first page a summary page. In the summary page
write statements comparing your work to answers given or videos. For
example, "I got the same answers as the Teach One video for question 1."
Including a statement in the summary that your work was approved by
peer-teachers.
For these assignment you can use any statistical package, including R,
SAS, and SPSS, Python. R packages and BNLearn are also used often. OpenBUGS and
Gibbs Sampler, Stan, OpenMarkov, and Direct Graphical Model are also open
source software. Netica is free for networks less than 15 nodes.
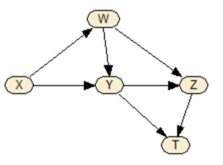
Question 1: Using the following graph, answer the
following questions:
- List the Markov Blanket of Y
- List the Markov Blanket of W
- List the parents in Markov Blanket of Z
- If we regress Z on X, W, Y, and not T, which variables will be
statistically significant (parents in Markov Blanket of Z)?
- For measuring un-confounded effect of Y on T, which arcs in the
graph should be stratified (removed)?
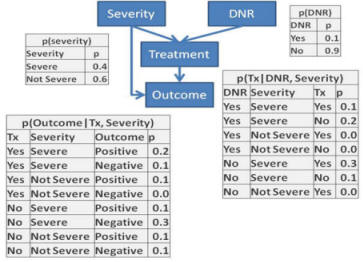
Question 2: In the following, calculate the probability of negative outcome under different scenarios.
Write an SQL code to calculate the probability of negative outcome in the situation
where the patient is severely ill and has not signed a "Do Not
Resuscitate" (DNR) order. Note that probabilities for
events that are mutually exclusive and exhaustive should add up to
one. In some SQL calculations, this is not the case.
Additional resources for Question 2:
Question 3: Redo problem 2 in Netica or other software and verify the accuracy of your answer.
To accomplish this, organize the 4-node network inside Netica and direct the links between the nodes, as in the graph structure in question 3.
Then for every node, enter the table of probabilities as per tables given in Question 3. For example, for the DNR node enter the
two probabilities of 0.1 and 0.9 into the Table within the node for DNR. Once the entire network (the graph and the related
probabilities) has been entered into Netica, answer following
questions:
- Evaluate the expected outcome for a patient who is severely ill and has not signed a "Do Not
Resuscitate" order.
- Evaluate the effect of treatment on outcome for patients who are
severely ill. Repeat for patients who are not severely ill.
What is the expected outcome when we stratify (remove the arc) for
severity of illness?
Resources for Question 3:
Question 4: Throughout this course we emphasize the
concept of Markov blanket. A Markov blanket refers to a set of variables
that would make all other variables irrelevant in predicting the response
variable.
- If X1 and X2 are significant predictors of Y, X3 and X4 are not,
and no interactions are significant; then what is the Markov Blanket
for Y? How is the concept of Markov Blanket related to
multi-colinearity?
- Suppose X2 occurs after Y and X1 occurs prior to Y, what is a Markov
Blanket that separates variables that are irrelevant and could possibly be
causes of Y. Keep in mind that a cause is something that occurs
prior to effect, has a significant association with the effect, has a
mechanism leading from cause to effect, and if cause is removed then the
effect is less likely to occur, Cetris Peribus.
Resources for Question 4:
Optional Question 5: The following network shows the relationship between
symptoms of COVID and its diagnosis (shown as positive test result).
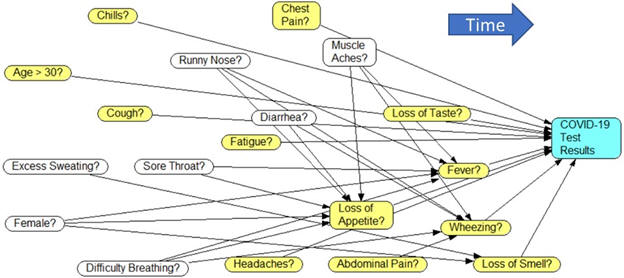
- Does knowing that a female patient has a positive test result
increase the chance that she is over 30 years old?
- Is it correct to say that patients with cough and fever have an
elevated chance of positive COVID test?
- List the 5 symptoms of COVID that appear last in progression of
the disease.
- Is muscle ache associated with positive COVID test result?
- When is throwing up not associated with positive COVID test
results?
- What is the Markov blanket of fever?
- What are the co-parents of fever?
- Is muscle ache a cause of fever or the reverse?
- Is sore throat a common cause or a common effect?
- If a patient does not currently have fever, what factors can be
used to establish whether the patient will develop fever later?
- What are two backdoor paths from COVID test results to loss of
smell?
- Is a runny nose associated with wheezing?
- What are 3 variables that indirectly predict COVID?
- What symptom most mediates the impact of largest number of
indirect variables on COVID test results?
- How many variables are direct predictors of COVID test results?
- Write an equation for calculating probability of fever from
patient's age, gender and other symptoms.
- If the patient does not report a symptom, should we assume that
the symptom was not present?
Resources for answering Question 5:
- See Exhibit 20.1 for definition of various terms in Big Data in
Health Care, Chapter 20, page 492
Optional Question 6: In the following directed graph, answer these questions:
- Is Z independent of V, if T is not observed?
- Is Z independent of V, if T is observed?
- Is U independent of V, if W or X are not observed?
Resources for Question 6:
- Professor Abbeel's lecture on directed separation
YouTube►
Optional Question 7: In the following network, calculate the
average effectiveness of treatment. First calculate the
probability of the outcome for treated patients. Then calculate the
probability of the outcome for patients not treated. Report the difference of the two
probabilities as the average treatment effectiveness. SQL or Netica could
help in solving this problem.
Additional resources for Question 7:
More
For additional information (not part of the required reading), please see the following links:
- Introduction to Markov process
Tim's Lecture►
- Explanation of predictions
Aloudah's Lecture►
This page is part of the HAP 823 course on Comparative Effectiveness by Farrokh Alemi, Ph.D.
Home►
Email►
|