
Assigned Reading
- Construction of network model from regressions (use instructor's last name as password)
Read►
- Analysis of temporal patterns in
EHRs
Slides►
Wiki►
Video►
YouTube►
- Logical inconsistencies, when using the paired comparison of events
Read►
- Arshia Firdaus Python code for temporal analysis
Slides►
Assignment
For this assignment you can use any statistical software.
Answers to assignments should be sent via Blackboard. Include
a summary statement.
Question 1: Classify COVID-19 based on its
symptoms.
- Describe the order of occurrence of the variables
- Assume that age, and gender occur at birth. Assume that
vaccination information occurs before onset of symptoms.
Assume home tests occurs after onset of symptoms. Assume
that laboratory PCR test occurs after home test.
- Establish the order with which symptoms occur
- Count for each pair of symptoms, the number of times one
symptom occurs before another. Use column AK in the
database to identify if one symptom has occurred before
another.
- Use the pairwise count of one symptom occurring before
another to establish a sequence of occurrence of symptoms.
Only prior symptoms can be independent variables in
analysis of later symptoms.
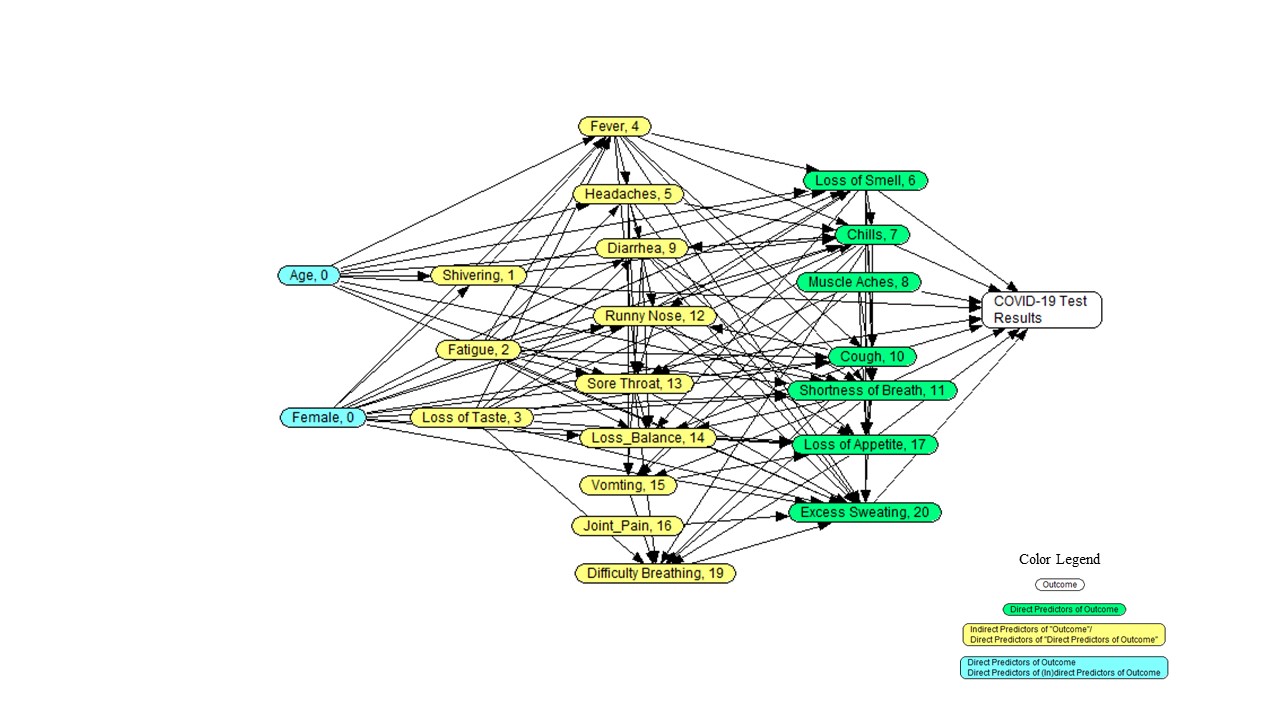
- Create a Causal Network for clusters of symptoms of COVID-19
- Create the structure of the network:
- Using LASSO, regress the PCR test results on all variables
and pairwise or triple cluster of variables that precede it.
- Using LASSO, regress each variable that is a direct
predictor of PCR test results on all preceding
variables. In these regressions, statistically significant variables are parents in the
Markov blanket of the regression response variable. The
order of the variables are given by the numbers in the
following image:
- What is the probability of COVID for a patient less than 30,
female, with runny nose, muscle aches, and with unknown fever status.
What is the same probability if we knew that the patient does not have
COVID.
- What are the parents in the Markov blanket of fever?
The following resources may be helpful:
- Data on alpha variant Download►
- Order of occurrence of symptoms
Excel►
- Alturki's Teach One for order of occurrence of variables
Slides►
Code►
- Arshia Firdaus Teach One for temporal analysis
Slides►
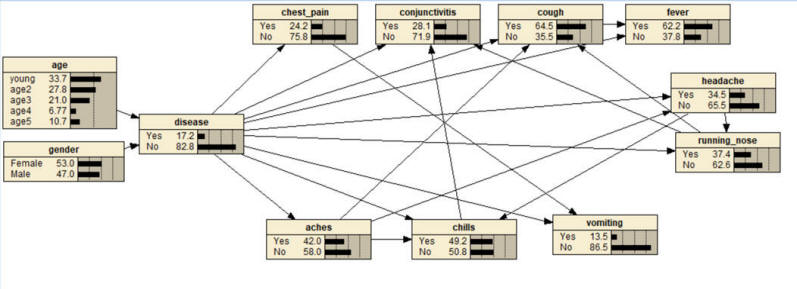
Question 2: Using the data provided and Netica
software, construct a network model of COVID-19, Influenza, and other
upper respiratory infections symptoms. Create a node at the center with
three levels.
- First, LASSO regress the disease variable on all symptoms, age and
gender. This regression will identify variables in the Markov blanket
of the disease.
- Second, identify parents and children in the Markov Blanket of the
disease variable. Symptoms, by definition, occur after the
disease and demographic variables occur prior to the disease.
Using Netica software, draw an arrow from the disease variable to
symptoms that were statistically significant in the LASSO regression.
Similarly, draw an arrow from demographic variables to the disease, if
the demographic variable was a significant predictor in the LASSO regression.
- Third, use each symptom that is statistically significant in first
step as a response variable for a new LASSO regression. The
independent variables in these regressions are the disease variable,
other symptoms, and gender. Using Netica, draw an
arrow from the variables that are statistically significant to the
symptom used as response variable. Repeat for other symptoms as
response variable. Here is a sample of the results of these
regressions. Note that findings above 0.15 or below -0.15 are
listed, the choice of 0.15 is arbitrary focus on large magnitude
associations. The relationships from age and gender to the symptoms
are not listed as all were not significant. Relationships that can
create a cycle are crossed out.
| |
Aches |
Chest
Pain |
Chills |
Red Eye |
Cough |
Diarrhea |
Fatigue |
Fever |
Head-
ache |
Nausea |
Runny
Nose |
Short
Breath |
Vomit |
Wheeze |
| Aches |
|
|
0.24 |
|
0.17 |
|
0.37 |
|
0.22 |
|
|
|
|
|
| Chest Pain |
|
|
|
|
|
|
|
|
|
|
|
0.17 |
|
|
| Chills |
0.18 |
|
|
0.41 |
|
|
|
|
0.16 |
|
|
|
|
|
| Red Eye |
|
|
0.40 |
|
|
|
|
|
|
|
|
|
|
|
| Cough |
|
|
|
|
|
|
|
0.27 |
|
|
0.17 |
|
|
|
| Diarrhea |
|
|
|
|
|
|
|
|
|
|
|
|
|
|
| Fatigue |
0.36 |
|
|
|
|
|
|
|
0.18 |
|
0.18 |
|
|
|
| Fever |
|
|
|
|
0.21 |
|
|
|
|
|
|
|
|
|
| Headache |
0.21 |
|
0.21 |
|
|
|
0.18 |
|
|
|
0.16 |
|
|
|
| Nausea |
|
|
|
|
|
|
|
|
|
|
|
|
0.54 |
|
| Runny Nose |
|
|
|
-0.16 |
0.21 |
|
|
|
|
|
|
|
|
0.15 |
| Short Breath |
|
0.28 |
|
|
|
|
|
|
|
|
|
|
|
0.36 |
| Vomit |
|
|
|
|
|
0.15 |
|
|
|
0.69 |
|
|
|
|
| Wheeze |
|
|
|
|
|
|
|
|
|
|
0.21 |
0.38 |
|
|
- Fourth, enable Netica software to learn the parameters of the
model or generate the joint distribution of the variables from
regression equations
- Fifth, report the probability of COVID-19 in a patient with fever, cough and runny nose and unknown other symptoms. Set these three
nodes to symptom being present and read the network probability for COVID-19.
Resources for question 2:
Question 3: This problem shows how temporal analysis
can be done based on pairwise information on occurrence of variables.
The following data shows the percent of people for which the symptom
listed in the row occurs before the symptom listed in the column.
- Identify which symptom occurs first.
- Which symptom occurs last.
- Which two symptoms occur closest to each other.
Resources for Question 3
- Data
Download►
- Pairwise comparison of order of variables
Wiki►
Slides►
- Zareen Taj Shaikh's Intelligent Tutor
PDF► (Upload into your AI Platform)
Optional Question 4: In your All of Us project, conduct a
temporal analysis counting the number of people for whom one condition
precedes another. Include the code for conducting such analysis in
response to this question.
Optional Question 5: This problem focuses on temporal analysis of
the variables. This problem was adapted from “Langville
AN, Meyer CD. The Science of Rating and Ranking Who’s Number 1. Princeton University Press, 2012“.
The following data show for how many people one disease
occurs before another. To judge which
disease occurs first, we focus on patients who had both disease. Patients
who had one but not the other disease do not count in these calculations. For
example, in patients who had both "D" and "M", for 7 patients "D" occurred before
"M";
and for 52 patients "M" occurred before "D". For
patients who had both "N" and "U", N occurs before U for 7 patients; and the reverse
occurs for 5 patients.
|
|
D
|
M
|
N
|
U
|
V
|
|
D
|
|
7
|
21
|
7
|
0
|
|
M
|
52
|
|
34
|
25
|
7
|
|
N
|
24
|
16
|
|
7
|
30
|
|
U
|
38
|
17
|
5
|
|
14
|
|
V
|
45
|
27
|
3
|
52
|
|
- Calculate for each disease, the sum of the number of times it occurs before other diseases. This is referred to as "point differential."
The point differential of disease "a" and "b" is the difference of number of
days "a" occurs before "b" minus number of times b occurs before a.
- Which disease occurs first?
- Calculate the temporal rank order of the diseases.
- Which two diseases are closet in time to each other.
Resources for Question 5:
More
For additional information (not part of the required reading), please see the following links:
- No-lab diagnosis of COVID-19
Read►
This page is part of the course on Comparative Effectiveness by Farrokh Alemi, Ph.D.
Home► Email►
|