Lecture: Use of IT in
Comparative Effectiveness
Assigned Reading
- How to conduct a matched case control comparative effectiveness study
Read►
Excel►
Jason's Tutorial►
- Causal analysis
- Measurement of severity of illness from claims data
Read►
Slides 2007►
Slides 2003►
Video►
SWF►
Lewis►
- Benchmarking clinicians
Read► You Tube►
Narrated slides and videos require Flash.
Download►
Advanced learners like you, often need different ways of
understanding a topic. Reading is just one way of understanding. Another
way is through writing about what you have read. The following
questions get you to think more about the concepts taught in this
session.
- Discuss how the paper on impact of Vioxx established the causal link between
the medication and mortality. In particular, what steps did the paper take
to check for the counterfactual argument that patients who had died would
not have died if they had not taken Vioxx.
- Did moderate use of Vioxx lead to higher cardiac events than other pain
medications? Was there a difference in type of patients that received
high-dose Vioxx and other medications? Could these differences explain the
association between Vioxx and cardiac events?
- Discuss how the paper on impact of Vioxx established risk score for various
cardiac risk factors. Did they adequately account for interaction among the
risk factors? What evidence is there that the adjustment for severity was
adequate?
- Besides association between two events, what else needs to be verified
before it can be inferred that one of the variables is causing the
occurrence of the other?
- Describe the HCUP data?
- Describe the limitations of Quality Indicators developed by the Agency for
Health Care Quality and Research.
- What is meant by counterfactual? In testing if a medication has led to
excess mortality, how would the measurement of severity of illness help
establish counterfactual claim that patients would have lived if it were not
for the medication.
- What is APR-DRG? Describe the data used for creating the APR-DRG.
-
Construct a simple Multi-Morbidity Index using the data in the Table below.
- Assess the average severity of CHF, MI, Diabetes, Hypertension, Alcohol
Use, and ACL surgery (assume that sicker patients have longer stays).
- Assess the overall severity of the 9 cases in the Table as the sum of
the severity of each of their diagnoses
- Plot the patient's length of
stay against the patient's severity of illness.
- A new patient with
MI, AA, and CHF is discharged in 3 days. Is this length of stay more, or
less, than what would we expect for these types of patients?
- Can
this procedure be repeated in an electronic health record, where there are
thousands of diagnoses and millions of cases?
Case
Type |
1st Diagnosis |
2nd Diagnosis |
3rd Diagnosis |
4th Diagnosis |
Length of stay |
Number of Patients |
| 1 |
MI |
CHF |
DM |
|
5.56 |
10 |
| 2 |
MI |
|
|
AA |
4.10 |
10 |
| 3 |
|
CHF |
DM |
AA |
5.54 |
10 |
| 4 |
|
CHF |
DM |
|
3.56 |
20 |
| 5 |
MI |
CHF |
|
AA |
7.03 |
30 |
| 6 |
MI |
CHF |
|
|
5.02 |
30 |
| 7 |
|
CHF |
|
AA |
5.04 |
30 |
| 8 |
MI |
CHF |
DM |
AA |
7.62 |
40 |
| 9 |
MI |
|
|
|
2.03 |
40 |
| 10 |
|
CHF |
|
|
3.03 |
40 |
| 11 |
MI |
|
DM |
|
2.60 |
50 |
| 12 |
|
|
DM |
AA |
2.57 |
50 |
| 13 |
|
|
DM |
|
0.61 |
60 |
| 14 |
|
|
|
AA |
2.12 |
70 |
| 15 |
|
|
|
|
0.01 |
80 |
| 16 |
MI |
|
DM |
AA |
4.57 |
120 |
|
MI = Myocardial Infarction;
CHF = Congestive Heart Failure; DM=Diabetes Mellitus; AA=Alcohol abuse |
- Identify which 2 patients in the following table could serve as
matched controls for the cases. Cases received the intervention and
controls did not. Blanks indicate patients who did not fall in
the time period. Match on age. Select the possible controls
randomly, using the lowest random number provided. For the
follow-up period in above problem, show a Kaplan Meier survival plot
of patients with no falls. Hafsa
A► Gabriella
C►
|
Patient ID
|
Received Intervention
|
Age
|
Months to Fall
|
Random Number
|
|
Observation Period
|
Follow-up Period
|
|
1
|
Yes
|
65
|
|
3
|
0.24
|
|
2
|
No
|
60
|
|
2
|
0.85
|
|
3
|
Yes
|
84
|
2
|
|
0.64
|
|
4
|
No
|
82
|
4
|
|
0.7
|
|
5
|
No
|
78
|
|
|
0.87
|
|
6
|
No
|
80
|
3
|
|
0.72
|
|
7
|
No
|
79
|
|
|
0.86
|
|
8
|
No
|
64
|
|
|
0.16
|
|
9
|
No
|
70
|
|
2
|
0.17
|
-
In the following questions assume that we have followed two
clinicians, Smith and Jones, and constructed the decision trees in
Figure 6.
Mariam A►Solution►
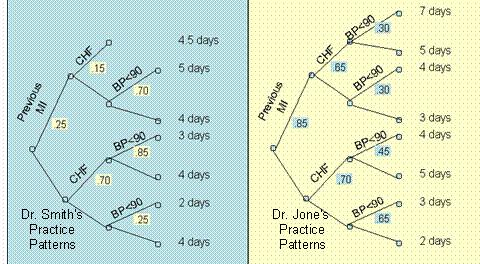
Figure 6: Dr. Jone's and Smith's Practice Pattern
- What is the expected length of stay for each of the clinicians?
- What is the expected length of stay for Dr. Smith if he were to take care of patients of Dr. Jones?
- What is the expected length of stay for Dr. Jones if he were to take
care of patients of Dr. Smith?
For additional information
(not part of the required reading), please see the following links:
-
Additional reading on how to analyze decision trees and event trees
Read►
-
Steve Short, Tampa General Hospital's Sr. Vice President & Chief
Financial Officer, talk on state of industry
Bio►
Slides►
-
Tutorial on structural modeling
Read►
-
Agency for Healthcare Research and Quality's reference guide for
effectiveness and comparative effectiveness reviews
Read►
Tutorial►
-
AHRQ quality indicators for electronic health record data
Slides►
This page is part of the course on
Information Systems.
This page was edited
05/16/2013 by
Farrokh Alemi, Ph.D. ©Copyright protected.
|