Assigned Reading
- Session overview
YouTube►
- Description of Stratified Covariate Balancing method
- Read Chapter 16 in Statistical Analysis of Electronic
Health Records by Farrokh Alemi, 2020
- Covariate Balancing through Naturally Occurring Strata
PubMed►
-
Slides►
- YouTube►
-
Video►
- Overlap calculations
- Code for covariate balancing:
Assignments
Submit assignments in Blackboard. Include in the first page a summary page. In the summary page
write statements comparing your work to answers given or videos. For
example, "I got the same answers as the Teach One video for question 1."
Question 1: The following data provide the length of
stay of patients seen by Dr. Smith (Variable Dr Smith=1) and his peer group
(variable Dr. Smith = 0).
Data►
Bindu's Teach One►
- Visually show that Dr.
Smith see a different set of patients than his peer group. Show a
tree where the nodes are the diagnoses and the consequences are length
of stay within the tree branch.
Decision Tree software►
- Balance the data through stratified covariate balancing.
Graphically show that the weighting procedure of stratified
covariate balancing results in same number
of different types of patients treated by Dr. Smith or his peer.
Switch the tree structure of peer group (but not the length of stay)
with Dr. Smith's tree. This could be the output from R package on Covariate Balancing.
Joseph's Teach One►
- Report the un-confounded impact of Dr. Smith on length of stay
using the common odds ratio of having above average length of stay.
SQL Common Odds►
- Reported the impact of Dr. Smith on length of stay using the
weighted length of stay.
SQL Weighted LOS►
Question 2: The following data provide the survival
among stomach cancer patients. The data provides 35 common comorbidities
for patients who have or don't have stomach cancer.
- Using SQL, group the diagnoses into commonly occurring strata.
- Within each strata, calculate the odds of mortality from cancer.
- Calculate the common odds ratio across strata.
- Conduct sensitivity analysis for the calculated common odds
ratio. Sensitivity analysis is the process of changing one
variable and re-examining the conclusions. Drop one of the 35
comorbidities from the analysis and repeat the entire analysis and
check that 65% of cases are matched to controls. The percent of
cases that are matched is called overlap. It is defined as:
In most problems, one wants to maximize the overlap to be around at least
80%, so that findings can be generalized to the original cases.
Report how the un-confounded and confounded odds of mortality from
stomach cancer are different from each other?
Data►
Using Synthetic Controls►
Using Parents in Markov Blanket►
Ujwala's Teach One►

Question 3: These data come
from STAR*D experiment conducted by National Institute of Medicine. Use instructor's last name as password.
Data►
Protocol►
The data report the experience of approximately 4,000 patients with
various antidepressants:
citalopram, bupropion, mirzapine, buspirone, lithium, nortriptyline,
sertraline, thyroid, tranylclypromine, and venlafaxine.
The following table
shows the distribution of the covariates in the data.
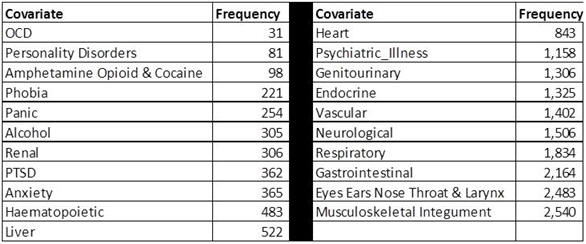
The data are reported for a total of 22,254 visits. Visits may
be 2 week or more apart. Not every patient shows for every
scheduled visit. Organize the data so there is one
row for each patient and each antidepressant trial (known in the
data as Concat). Note that this field considers
combination of antidepressants as a new antidepressant. Ignore the dose of the medication. Patients received multiple antidepressants
during these trials until something worked for them. Include each time a
new antidepressant was tried as a separate trial. If the patient has taken the
antidepressant at any time during the trial, then mark it
as 1, otherwise 0. Notice that some patients have taken the
medication and others have not. Patients who have not taken a
particular medication have taken other medications, so at any
time we are comparing one medication to alternative treatments.
The medication is considered to
have caused the remission if the patient is referred to follow
up portion of the study, at any point while taking the
medication; i.e. the variable
"Treatment_plan_equal_3" is set to 1 while taking the
medication .
- Clean the data
SQL►
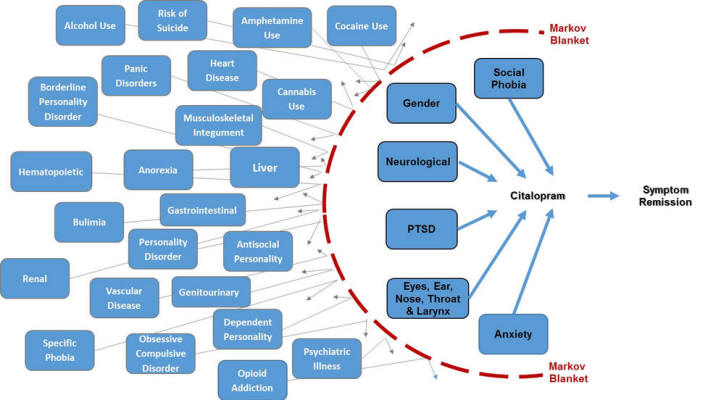
- For 3 antidepressants, balance the data using SQL and stratified covariate balancing.
- If necessary use parents in Markov Blanket of the medication to
improve overlap beyound 80%.
- Describe which of the 3 medications should a patient who has PTSD and
neurological disorders take.
SQL►
Question 4: The following data have been taken from nurses
rounding in a facility. The time they spent with patients has been
recorded. In addition,
several characteristics of the patients have also been recorded and
standardized. Using stratified covariate balancing indicate if any of the nurses have a
significant impact on overall satisfaction in the unit?
Please note that the listed teach one assignment uses the wrong command
for stratified covariate balancing package.
Data►
Polly's Teach One►
New R Package►
Zabowski's Answer►
Question 5: In a nursing home, data were
collected on residents' survival and disabilities. The data are
listed in the following order: ID, age, gender (M for male, F for
Female), number of assessments completed on the person, number of days
followed, days since first assessment, days to last assessment, unable
to eat, unable to transfer, unable to groom, unable to toilet, unable to
bathe, unable to walk, unable to dress, unable to bowel, unable to
urine, dead (1) or alive (0), and assessment number.
- Does inability to eat increase probability of mortality in 6 months?
Use SQL and stratified covariate balancing to determine if inability to
eat contributes to mortality, after controlling for other disabilities
of the patient. Data►
Adel's Teach One►
Adel's SQL Code►
- Does inability to toilet contribute to survival? To answer
this question several steps must be taken. First, later events
must be ignored. These are events that occur after the patient
is unable to toilet. Second, the stratification need only occur
among parents in Markov Blanket of "Unable to toilet". A quick
way to identify the parents in the Markov Blanket of "Unable to
Toilet" is to regress it on all the variables that precede it.
Then the variables that are signficant and have large effect size
(procedure to simulate LASSO regression) must be stratified.
SQL and R Code►
Question 6: The following data show the variation in diabetes in
select counties across United States. Using stratified covariate
balancing report the impact of access to supermarkets on diabetes after
controlling for other variables.
Data►
Monotone?►
- Simplify the database. Please organize the data so all
independent variables are measured in the next to last available
year. The outcome variable is diabetes and should be measured in
the last year. Ignore all other data, including data on
independent variables in prior years.
- Describe the data. Check that all independent variables are positively and monotonely related to
prevalence of diabetes in the last year in the county. Split variables that are not monotonely related to prevalence of
diabetes into 2 or more variables that are positively and monotonely
related to diabetes
- Calculate impact of variables on diabetes in the last year
- Calculate the impact of obesity in prior year on diabetes in
the last year, while controlling for
other variables in prior year. Use Stratified Covariate
Balancing to calculate the impact.
- Calculate the impact of access to food sources in prior year on diabetes
in last year, while
controlling for other variables. Use Stratified Covariate
Balancing to calculate the impact.
More
For additional information (not part of the required reading), please see the following links:
- Alemi and Amr's original paper on covariate balancing
Pubmed►
- Predictors of response to citalopram Read►
- Does citalopram help anxious depressions
Read►
-
Collapsing strata
Read►
This page is part of the course on
Comparative Effectiveness by Farrokh Alemi, Ph.D.
Home► Email►
|