
Generated by ChatGPT
Overview
In this module, you'll continue to master the art of analyzing the
association of variables with binary data. You'll interpret findings from
logistic regression, allowing you to draw meaningful conclusions from your
analyses. You'll develop techniques to adjust for missing values in
logistic regression, enhancing the accuracy and reliability of your
results. All along, you will tackle real-world data challenges and make
informed decisions based on your analyses.
Learning Objectives
- Interpret findings from logistic regression analysis
- Adjust for missing values in logistic regression
Lecture
 Indicates
content, image, or video made with assistance from AI systems Indicates
content, image, or video made with assistance from AI systems
- Read Chapter 12 Logistic Regression in Statistical Analysis of Electronic Health Records by Farrokh Alemi, 2020
Slides►
Video►
- More on missing values
Read►
Slides►
- Yili Lin's lecture on interpreting R output for Logistic regression
Slides►
Video►
Assignments
Question 1: The following data provide the length of stay of patients seen by Dr. Smith (Variable Dr Smith=1) and his peer group
(variable Dr. Smith = 0). Does Dr. Smith see a different set of patients than his peer group? In particular, what is the
probability of patients being seen by Dr. Smith. Regress the choice of provider on the 9 diagnoses provided.
Resources:
 Question 2: In a nursing home, data were collected on residents' survival and disabilities. The data are
listed in the following order: ID, age, gender (M for male, F for Female), number of assessments completed on the person, number of days
followed, days since first assessment, days to last assessment, unable to eat, unable to transfer, unable to groom, unable to toilet, unable to
bathe, unable to walk, unable to dress, unable to bowel, unable to urine, dead (1) or alive (0), and assessment number.
Predict from the patient's assessments (i.e. their age and current disabilities at time of assessment) if the patient is likely to die. Here are the steps in this
analysis: Question 2: In a nursing home, data were collected on residents' survival and disabilities. The data are
listed in the following order: ID, age, gender (M for male, F for Female), number of assessments completed on the person, number of days
followed, days since first assessment, days to last assessment, unable to eat, unable to transfer, unable to groom, unable to toilet, unable to
bathe, unable to walk, unable to dress, unable to bowel, unable to urine, dead (1) or alive (0), and assessment number.
Predict from the patient's assessments (i.e. their age and current disabilities at time of assessment) if the patient is likely to die. Here are the steps in this
analysis:
- Read the data, making sure all entries are numbers.
- Calculate age at each assessment not just at first assessment.
- Clean the data, removing impossible situations (remove cases with date of assessment after death).
- Remove irrelevant cases (all cases that have only one assessment)
- Organize age at current admission into a binary variable above or below the average age at current assessment.
- Estimate missing values
- Regress death in 6-months on various current disabilities, age,
gender, and pairwise interactions of these variables.
Resources:
Question 3: In a nursing home, data were collected on residents' survival and disabilities. The data are
listed in the following order: ID, age, gender (M for male, F for Female), number of assessments completed on the person, number of days
followed, days since first assessment, days to last assessment, unable to eat, unable to transfer, unable to groom, unable to toilet, unable to
bathe, unable to walk, unable to dress, unable to bowel, unable to urine, dead (1) or alive (0), and assessment number. Predict from
the patient's assessments (i.e., their age and disabilities at time of assessment) if the patient is likely to die and should be admitted to
the hospice program.
Resources for Question 3:
Question 4:
Regress incidence of diabetes on all other body-system variables
(including pairwise, and triplet of variables) and indicator variables
for missing variables. You can do the analysis first on 10% sample
before you do it on the entire data that may take several hours.
- Create a binary variable that is 1 every time a variable is missing and 0 otherwise. Predict
diabetes from patterns of missing binary variables.
- Create binary variables for missing values.
- Calculate number of variables that are missing for each case
- Create a cascaded data, where cases are arranged in order of
number of variables missing. Put all missing variables last.
- Create interaction terms for missing indicators so that the
interaction term corresponds with patterns of missing variables in
the cascaded data.
- Test the statistical significant of missing indicators and
interaction among missing indicators.
- Report the percent of variation in incidence of diabetes
explained by patterns of missing variables
- Regress diabetes on body systems, pairs of body systems, triplets
of body systems, and statistically significant patterns of missing
values. Report the coefficients and the percent of variation explained.
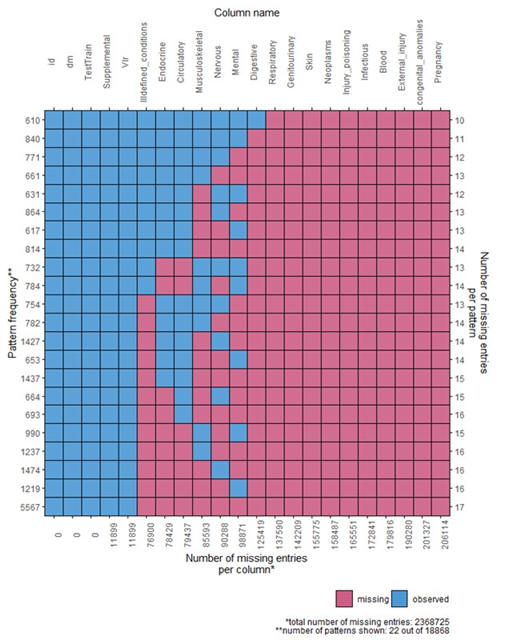
One way to reduce the number of independent variables is to drop body
systems that are always missing. When a variable is always
missing, then regression software automatically drop these variables.
You can save computation time by dropping the variables before
analyzing the data. The plot below shows body systems and extent
of missing values within them.
Resources for Second Week Question 4:
This page is part of the HAP 719 course on Advanced Statistics I by Farrokh Alemi PhD
Home►
Email►
|