|
|
HAP 719: Advanced Statistics IRegression through Search
OverviewIn this module, you'll gain the skills to analyze data by searching for key cases within a database, a technique that is essential for identifying significant patterns and trends. You'll learn to detect interactions among variables, which will help you understand the complex relationships within your data. Additionally, you'll master the ability to estimate regression parameters for massive datasets without relying on matrix manipulations, a crucial skill for handling large-scale data efficiently. These capabilities will empower you to tackle real-world data challenges and uncover valuable insights, making you a sought-after professional in any data-driven field. Learning Objectives
Lecture
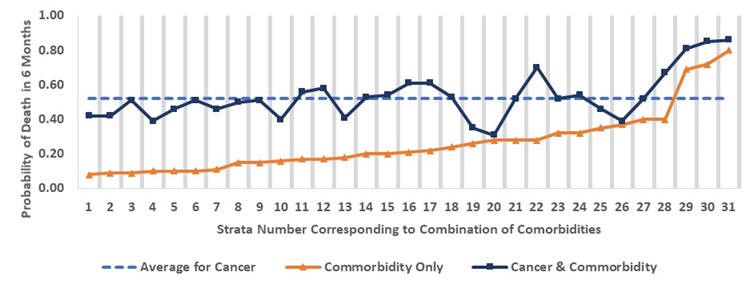
AssignmentsQuestion 1: In the following estimate the regression equations from a plot of the data across strata. On the X axis, each number refers to a unique combination of diseases in the patient's medical history. The X-axis is a variable that captures the patients' prognosis based on their medical history. The Y axis shows the probability of mortality. Three lines are plotted. The line with diamonds shows the probability of mortality for each of the strata on the X axis. The line with squares shows the probability of mortality for combination of strata and stomach cancer. The dashed line shows the average probability of stomach cancer, across all strata.
Answer the following questions?
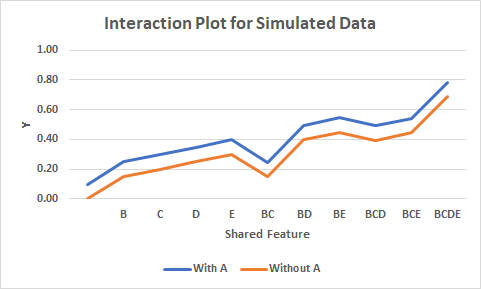
Resources for Corner Cases Question 1: Question 2: In the following data, Y is a binary outcome. A, B, C, D, and E are five binary independent variables that predict Y.
Resources for Question 2: Question 3: In the following, Y indicates the logit of probability of an outcome. It is regressed on X1 through X4. All variables are binary. All independent variable are monotone. All are related to Y. Y values are standardized so that when all independent values are absent logit of y is 0 and when all are present logit of Y is 1. Using the technique of searching the data to construct approximate regression equations, answer the following questions:
Resources for Question 3:
Question 4: In the following, we regress Y on five binary variables that are positively related to Y.
Resources for Question 4
MoreFor additional information (not part of the required reading), please see the following links:
This page is part of the HAP 819 course on Advanced Statistics by Farrokh Alemi PhD Home► Email► |
|


