Assigned Reading
-
Introduction to
Causal Networks
Read►
- Learning network models
- Causal impact, d-separation and backdoors
Slides►
- More
- Optimizing stratification
Read►
- Impact of sequence on accuracy of network learning algorithms
Read►
- Relationship between independence, causality, and graph structure
Video►
Slides►
Assignment
For this assignment you can use any statistical package, including R,
SAS, and SPSS. Your instructor is familiar with Netica and
BayesiaLab. R packages are also used often. OpenBUGS and
Gibbs Sampler, Stan, OpenMarkov, and Direct Graphical Model are open
source software. Netica is free for networks less than 15 nodes. A more complete list is available in Wikipedia
under "Bayesian Networks."
OpenBUGS►
Stan►
Direct Graphical Models►
OpenMarkov►
Graphical Models Toolkit►
PyMC►
Genie Smile►
SamIam►
Bayes Server►
AIspace►
BayesiaLab►
Hugin►
AgenaRisk►
dVelox►
System Modeler►
UnBBayes►
Uninet►
Tetrad►
Dezide►
Netica►
Work on this assignment can be done in group's of two students but you cannot work with a student that you have previously teamed up with.
- Draw networks based on the following independence assumptions.
When directed networks are possible, give formulas for predicting
the last variable in the networks from marginal and pair-wise
conditional probabilities. Keep in mind that absence of
independence assumption implies dependence.
Review►
| Nodes in Network |
Assumption |
| X, Y,
Z |
I(X,Y) |
| X, Y,
Z |
I(X,Y), Not I(X,Y|Z) |
| X, Y,
Z |
I(X,Y), I(X,Y|Z), Y
measured last |
| X, Y,
Z, W |
I(X,Y), I(X,Y|Z),
I({X,Y},W|Z), W measured last |
| X, Y,
Z, W |
I(X,Y), I(Z,W), and
X measured before Z and Y measured before W |
Wang's Teach One
Video►
- Construct a Bayesian probability network model that would
predict success with antidepressants. A network model will include
variables, and mediators of the effect of variables, on response to
the antidepressant. Include all baseline diagnoses and gender as
covariates. Include previous antidepressants as covariates.
To understand the sequence of trying antidepressants, examine the
following figure:
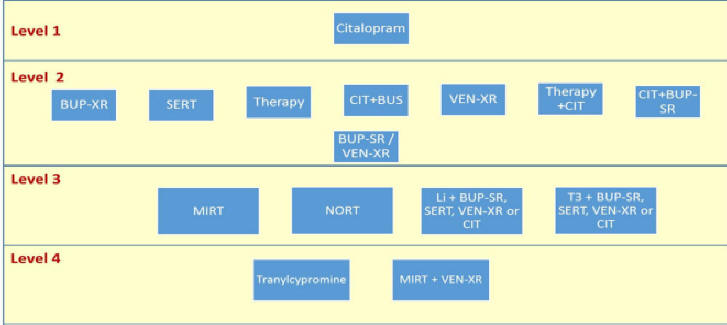
Calculate remission if the patient was on the
antidepressant. Remission or relapse should be considered an end
node. Gender is a root node. All other variables, e.g. diagnoses,
could be either root or intermediary nodes but all occur prior to
use of antidepressant. The antidepressants that were given
prior to an antidepressant should be used as a covariate. The
data has been modified to report per person data, without
visit-based information.
Data►
(a)
Identify the parents in the Markov blanket of citalopram using
bnLearn software in R and a constraint based algorithm such as Grow
Shrink. All baseline diseases occur prior to treatment with
citalopram.
(b) Identify the parents in Markov blanket of
citalopram using regression analysis.
Amr's Regression Code►
(c) Identify impact of
citalopram on response using stratified covariate balancing
(d) Using the
network model, predict the response to citalopram for a patient with
neurological disorder, and PTSD.
(e) Using SQL, predict response
to citalopram for a patient with PTSD and neurological disorders, based on the nearest strata. SQL
for Similar Strata►
- Write an SQL code to calculate the probability of negative outcome in the situation
where the patient is severely ill and has not signed a "Do Not
Resuscitate" (DNR) order. Note that probabilities for
events that are mutually exclusive and exhaustive should add up to
one.
Data►
Bushra's Teach One►
Anto's Teach One►
Slides►
SQL►
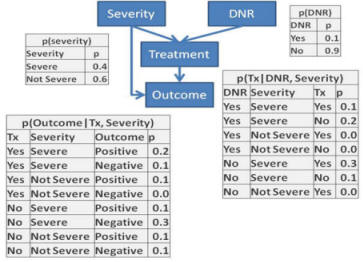
- Redo problem 3 in Netica or other software and verify the
accuracy of your answer.
To accomplish this project organize the 4 node network inside Netica
and direct the links between the nodes as in the graph structure.
Then for every node, enter the table of probabilities as per tables
given in Question 3. For example, for the DNR node enter the
two probabilities of 0.1 and 0.9 into the Table within the node for
DNR. Once the entire network (the graph and the related
probabilities) has been entered into Netica, evaluate the risks
for a patient who is severely ill and has not signed a "Do Not
Resuscitate" order.
Netica►
Shruti's
Teach One►
Usman's Teach One►
-
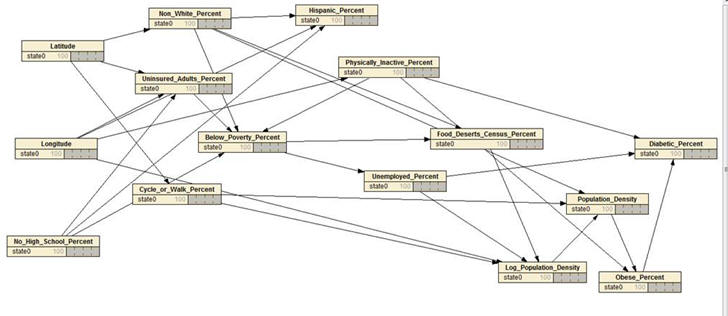
The following data show the variation in diabetes in select counties across United States. Using stratified
covariate balancing report the impact of food deserts, PER_FD, on diabetes,
PER_DM, after controlling for other variables. The data file
includes dictionary of variables as well as a list of impossible
relationships that should be blacklisted.
Data►
- Exclude GEOID, STATEFP, COUNTYFP, and NAME. These are ID or
nominal variables that are not informative in the context of this
analysis.
- Check that all remaining variables are positively and monotonely related to prevalence of diabetes in the county
in 2013. Monotone?►
- Use the R software package for stratified covariate balancing to examine the effect of Per_FD, percent of the census
tracks with food deserts, on PER_DM, percent diabetic in 2013. Control for all parents in Markov Blanket of PER_FD. Make sure
that you blacklist impossible arc directions.
Instruction►
New SCB Code►
- Use R software package bnlearn to fit a network model to the data, making sure that you blacklist impossible arc directions.
- Redraw the network model using Netica software, making sure that variables that occur later are placed more to the right.
Netica►
- Inside an electronic health record, there are data on outcomes of a
particular intervention. Using the network drawn below, write
the equations that would allow you to estimate what would happen if
the intervention was not given. First, write an equation for
each node in the network based on variables that precede it.
For example, the regression equation for predicting whether there is
an adverse event is given by the equation:
Outcome = a + b Treatment + c Severity
Second, set the variables that change across these equations to the
relevant values. For example, set Treatment to be zero.
See Velosky's Teach One►
- The following graph was used to simulate data on bundling payment for total hip fracture treatment:
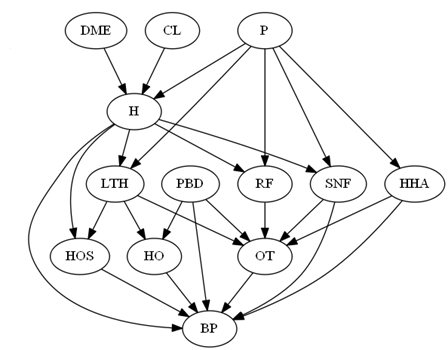
More
For additional information (not part of the required reading), please see the following links:
- Introduction to causal inference
Read
1►
Read 2►
Video►
Slides►
- Meta analysis through Bayesian networks
Read►
- Introduction to Bayesian networks
Read►
- Learning Bayesian Networks
Read►
- Selection of Judea Pearl's articles
PubMed►
- Applications of Bayesian networks in healthcare PubMed►
- Use of graphs in removing confounding Read►
- Learning Bayesian networks from correlated data Read►
- Bayesian networks in neuroscience Read►
- Cost analysis using Bayesian networks Read►
- Comparison of Bayesian network and logistic models Read►
- Bayesian network classifiers
Read►
- Introduction to Markov process
Tim's Lecture►
- Explanation of predictions
Aloudah's Lecture►
- Outcome based prescribing for citalopram
Slides►
This page is part of the course on Comparative Effectiveness by Farrokh Alemi, PhD Home►
Email►
|