|
|
Benchmarking & Clinician Profiles
Assigned Reading
Use data balancing to benchmark clinicians (use instructor's last
name as password)
Read►
Presentations
Assignments
Start with a summary page. Start each question in a separate
page,
sheet, or file. In the summary page
write statements comparing your work to answers given or videos. For
example, "I got the same answers as the Teach One video for question 1."
Question 1:
In the following question, use SQL to analyze the data. Assume that we have followed two clinicians, Smith
and Jones, and constructed the decision trees in Figure 1.
Data►
Atoosa's
Excel►
Pooja's Video►
SQL Code►
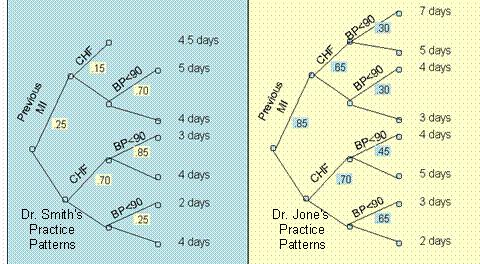
Figure 1: Practice Patterns of Dr. Jones and Smith
- What is the expected length of stay for each of the clinicians?
- What is the expected length of stay for Dr. Smith if he were to take care of
patients of Dr. Jones?
- What is the expected length of stay for Dr. Jones if he were to take of patients
of Dr. Smith?
Question 2: The following data report
patients with 10 Diagnostic Related Groups and 3 HCC indices cared for by a clinician and
his peer group.
Data►
- Regress "Cared for by Dr. Smith" on the HCC and other
patient charcteristics. What type of patients are more likely to
be cared for by Dr. Smith. Regression Results►
- Using regression results, identify which variables are likely to
be in the Markov Blanket of the variable "Cared for by Dr. Smith".
- Use SQL to determine if the clinician is more efficient than
his peer group.
SQL►
Mai's Teach One►
Question 3: The following data show the variation in
diabetes in select counties across United States. Using stratified
covariate balancing report the impact of access to supermarkets on
diabetes after controlling for other variables.
Data►
- Check that all variables are positively and monotonely related to prevalence of diabetes in the county.
Monotone?►
- Assign a binary variable to each variable in such a manner that
when the variable is 1, diabetes is more likely.
- Drop from analysis covariates that are not parents on Markov
Blanket of diabetes. Accomplish this task using the following
steps:
- Regress diabetes on all variables (with no interaction terms
in the model), identify variables that are signficant predictors
of diabetes and have a large effect size
- Do a second regression, verifying that no interaction terms
that involve the signficant variables are predictors of diabetes
(have a statistically signficant and large effect size). Include
on the list of parents of Markov Blanket, any variable whose
interactions is predictive of diabetes.
- Calculate the impact of access to food sources on diabetes, while controlling for other variables. Accomplish
this task by stratifying the variables identified as parents in the
Markov Blanket, then switch the distribution of controls (low-diabetic
counties) with distribution of cases (high diabetic counties).
- Report overlap and impact of food access on diabetes.
Question 4: In synthetic cases we predict the
probability of an event from the relevant data. In this question you
are asked to create a synthetic case where insufficient data exists.
You are asked to predict 6-month mortality
rate for 80 year nursing home residents with walking and toileting
disabilities but no other disabilities. There are not 30 such cases
in the data. You are asked to predict what this value would have
been based on 2 nearest data points.
- Verify that there are less than 30 cases in the database of 80
year olds who only cannot walk and toilet.
- Verify that all variables
lead to increased mortality. If not, re-name the variables so when the
variable is assigned the value of 1, it has higher probability of
mortality.
- Excessive Match: Add one additional disability to the
list until you find 30 cases. These additional cases are
excessive matches in the sense that these cases have additional
disabilities that increase probability of mortality. For example,
when you add unable to urine to 1 then you are including cases
that also have urine incontinence. For another example, setting
unable to eat to 1 will examine patients who cannot walk, toilet
or eat. For each excessive match calculate the number of
cases and the probability of being dead in 6 months.
- Partial Match: Remove one of the disabilities of the
patient and calculate number of cases and average probability of
mortality in 6 months. In this example we are looking at 80
year old who cannot walk or toilet. Remove toilet and see if
you get 30 cases. Calculate number of cases you can match.
Calculate probability of mortality of these cases in 6 months.
- Calculate the probability of mortality for the synthetic case as
average of the minimum of excessive matches and maximum of partial
matches.
-
SQL►
Use the following
dictionary of variables to create a header for the data.
Data►
Adel's Teach One►
|
Order |
Variable |
Description |
| 1 |
ID |
Resident's ID |
| 2 |
Age |
Age at first assessment |
| 3 |
Sex |
Gender of resident |
| 4 |
tAssess |
Number of assessments |
| 5 |
Followed |
Days resident followed |
| 6 |
DaysFirst |
Days from first assessment |
| 7 |
DaysLast |
Days to last assessment |
| 8 |
uEat |
Unable to eat |
| 9 |
uSit |
Unable to sit |
| 10 |
uGroom |
Unable to groom |
| 11 |
uToilet |
Unable to toilet |
| 12 |
uBathe |
Unable to bathe |
| 13 |
uWalk |
Unable to walk |
| 14 |
uDress |
Unable to dress |
| 15 |
uBowel |
Bowel incontinent |
| 16 |
uUrine |
Urine incontinent |
| 17 |
EverDead |
Patient dead at one point in time |
| 18 |
AssessID |
Assessment ID |
| 19 |
Dead6Months |
Dead within 6 months of assessment |
Question 5: The following data show the recovery from various
disabilities in two nursing homes. Two sets of data are presented.
The first set shows the disabilities of the patients at admission to the
nursing home, using variables that start with "u", standing for "unable".
The recovery from the disabilities is also shown in variables that start
with "r". Compare the performance of these two nursing homes using
distribution switch method. In particular, switch the distribution
for age, gender, and 9 disabilities on admission. The outcome
of interest is the number of disabilities recovered from (variable shown
as nRecovery). Use synthetic method to estimate outcome for cases not present in both nursing homes. Which nursing home has better
outcome for its own residents? What happens if residents at nursing
home A were cared for at nursing home B, which nursing home would have
better outcomes? What will happen if the reverse happens?
Data►
SQL & Answer►
Question 6: The following data provide the length of
stay of patients seen by Dr. Smith (Variable Dr. Smith=1) and his peer group
(variable Dr. Smith = 0). Balance the data by propensity to seek care from Dr. Smith.
This involve first predicting probability of a patient type
utilizing services of Dr. Smith; then weighting the data inversely
proportional to the probability of using Dr. Smith. Note that
patients cared for by Dr. Smith and by his peer group will have a
different set of weights. The net results of weights is that
patients cared for by Dr. Smith and his peer will have the same rate
of various diseases. (a) Graphically show that the weighting procedure
you followed results in same set
of patients treated by either Dr. Smith or his peer. (b) Report the un-confounded impact of Dr. Smith on length of stay.
- Practice profiling PubMed►
- Importance of risk adjustment in measuring performance in primary care PubMed►
Prepared by
Farrokh
Alemi, Ph.D.
This page is part of the course on
Statistical
Process Improvement |