 |
|
Benchmarking CliniciansThis week we discuss benchmarking and how you can compare apples-to-apples and oranges-to-oranges. Clinicians and their peer groups differ in types of patients they see. We will show you how to use data balancing to compare them on the same type of patients. We motivate the concepts using decision trees but then move quickly to using Structured Query Language for large data analysis. This week is unusual for a course on process improvement. Statistical process control classes rarely talk about benchmarking. When they do, they rarely talk about data balancing. This stuff is the real frontier of the field. Stay with me as we go through the theoretical basis of it, concepts like distribution switches and synthetic cases may seem new and somewhat esoteric but stay with the material as the end result is practical and useful. Assigned Reading
Presentations
AssignmentsInstruction for Submission of Assignments: Assignments should be submitted directly on Blackboard. In rare situations assignments can be sent directly by email to the instructor. Submission should follow these rules:
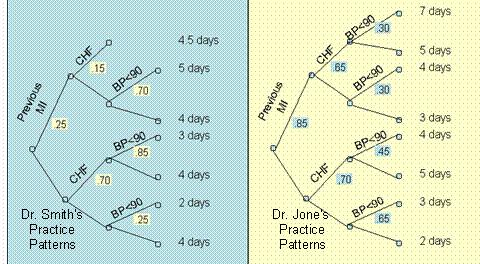
Question 1: In the following question, use SQL, Python, or Excel to analyze the data. Assume that we want to compare two clinicians, Smith and Jones, who see different types of patients at different rates and different length of stay. The data for each clinician is provided in the two decision trees in Figure 1.
Question 2: The following data report patients with 10 Diagnostic Related Groups and 3 HCC indices cared for by a clinician and his peer group. Is the clinician more efficient than his peer group. Contrast the clinician's performance to what would have happened if the peer group had taken care of the patients' of the clinician..
Question 3: The following table shows the observed and expected length of stay for 30 patients. Use paired comparison of means to test that the expected and observed length of stay are the same. Assuming normal distribution of the length of stay, use risk-adjusted control chart to plot the data. Make sure that control limits are derived from the expected values and observations are contrasted to these limits. This analysis can be done using Tukey or XmR and you need to select which chart produces tighter control limits. The conclusions you arrive at based on (a) paired comparison of expected and observed length of stay and (b) the risk-adjusted control charts should be the same if in both situations we were calculating the control limits from the same number of cases. Are they?
Question 4: Use the procedure described for outcomes in synthetic cases, to estimate mortality rate for 80 year residents with walking and toileting disabilities but no other disabilities. Note that we want to rely on at least 30 cases in making this estimate. In the database there are not 30 cases with these two disabilities and 80 years of age. Therefore, we would like you to estimate the survival days using synthetic case outcomes. You can create a synthetic case from 80 year olds who are unable to walk and residents who are unable to toilet. Alternatively you can select a different set of residents, such as 80 year olds who are unable to toilet and residents who are unable to walk.
Also note that the data do not have headers. Use the following dictionary of variables to create a header for the data
Question 5: The following data show the recovery from various disabilities in two nursing homes. Two sets of data are presented. The first set shows the disabilities of the patients at admission to the nursing home, using variables that start with "u", standing for "unable". The recovery from the disabilities is also shown in variables that start with "r". Compare the performance of these two nursing homes using distribution switch method. In particular, switch the distribution for age, gender, and 9 disabilities on admission. The outcome of interest is the number of disabilities recovered from (variable shown as nRecovery). Use synthetic method to estimate outcome for cases not present in both nursing homes. Which nursing home has better outcome for its own residents? What happens if residents at nursing home A were cared for at nursing home B, which nursing home would have better outcomes now? What will happen if the reverse happens? Question 6: The following data report length of stay (LOS) for 10 patients of Dr. Jones and 10 patients of Dr. Smith. What is the expected outcome (average outcome) for Dr. Smith? What is the expected outcomes if Dr. Jones if he was seeing Dr. Smith's patients? To answer this question, replace each outcome of Dr. Jones with average outcome of same type of patient seen by Dr. Smith. Is Dr. Smith more efficient than Dr. Jones? Make sure that you submit an Excel sheet with formulas for all calculated values.
Question 7: In data presented in question B, what is the expected outcome if Dr. Smith sees patients of Dr. Jones? Note that Dr. Smith does not see any patient like patient 4 of Dr. Jones. We need to estimate a synthetic control for this patient. To do so, filter the data for patients of Dr. Smith (this is already done since the data of Dr. Smith is presented separately). Regress length of stay on previous MI, CHF and Shock. You learned about regression in the first part of this course. Evaluate the regression equation at values corresponding to the condition of patient 8 of Dr. Jones. Use the regression prediction of length of stay to create a synthetic patient for Dr. Smith and calculate the expected outcome for Dr. Smith seeing patients of Dr. Jones. Make sure that you submit Excel sheet with formulas for all calculated values.
More
Prepared by Farrokh Alemi, Ph.D. This page is part of the course on Statistical Process Improvement | ||||||||||||||||||||||||||||||||||||||||||||||||||||||||||||||||||||||||||||||||||||||||||||||||||||||||||||||||||||||||||||||||||||||||||||||||||||||||||||||||||||||||||||||||||||||||||||||||||||||||||||||||||||||||||||||||||||||||||||||||||||||||||||||||||||||||||||||||||||||||||||||||||||||||||||||||||||||||||||||||||||||||||||||||||||||||||