 |

|
Comparison of Means |
||||||||||||||||||||||||||||||||||||||||||||||||||||||||||||||||||||||||||||||||||||||
|
This week we focus on X-bar control charts. These kinds of control charts allow us to examine average outcomes of care over time. They are built on the assumption that average of observations have a normal distribution. There is a surprising theorem in statistics that says that if we take the average of more than 4 data points, the average will have near normal distribution. It is like saying that all roads end in Rome, now we are saying don’t worry, everything will end up being normal. This week we discuss both traditional X-bar control charts and risk-adjusted control charts. We will also download data from CMS’s hospital compare so that you can analyze real data. You’ll get to see how your hospital performs on a number of measures of satisfaction and cost of care. Assigned Reading
Presentations
AssignmentsInstruction for Submission of Assignments: Assignments should be submitted directly on Blackboard. In rare situations assignments can be sent directly by email to the instructor. Submission should follow these rules:
Question 1. In Health Administration Programs conducting satisfaction surveys are usually covered in courses on quality improvement. This exercise shows how data from satisfaction surveys can be analyzed over time. Assume that, in different time periods, 4 randomly selected patients rated their satisfaction with our services. Are we improving?
Question 2. In Health Administration programs accounting courses typically cover cost data. Forensic accounting examines tries to detect fraud through accounting procedures. Following data were obtained regarding the cost of taking care of patients over several time periods. Are our costs within expectation?
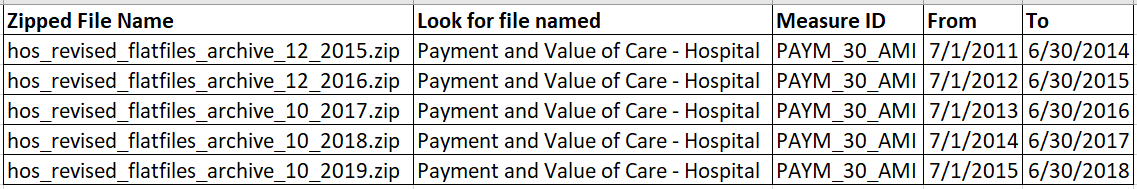
Question 3: Payment reform has made hospital payments more complex. One issue in payment reform is whether the net payments to hospitals is decreasing because of numerous carve outs for never-events. In health administration programs, payment reform is covered in several courses including courses on value-based payments, finance, quality and strategic planning. In this assignment, examine if payments for AMI have declined over 4 time periods indicated in the table below. Keep in mind that start and end periods of data are also given inside the files and that these do not correspond to the database reporting year. Also note that the name of variables and files change over the years. Here are some years and how the name of the variable changed:
Make sure that you download data for every year the measure PAYM_30_AMI is available for all available hospitals. In these files the denominator indicates the number of patients. Payment indicates average payment per patient. Select data for hospitals that had at least 100 patients. Submit a control chart for the data. Question 4: Download the data, specified below, for all quarters and years data are available from Hospital Compare. Use as many years as available. Unzip the files and select select the file for "HCAHPS - Hospital". This is the file for satisfaction surveys. Within these file select HCAHPS measure ID of "H_COMP_6_LINEAR_SCORE ". This is the linear mean of ratings of surveyed patients. It is a value between 0% and 100%, with 100% indicating most satisfied patients. Compare the performance of "Sibley Hospital" to its competitors in DC (providers 90001 90003 90004 90005 90006 90008 90011 93300). Are satisfaction levels in Sibley better than its competitors in DC?
Question 5: Calculate the Probability of observing Z values in the following ranges in a normal distribution. Answers are provided, show your intermediary table look-up values and calculations. Z calculator► Answer►
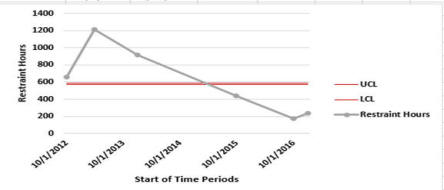
Question 6: Using the databases from Hospital Compare, download quarterly data on average number of hours of restraints from the file "HOSPITAL_QUARTERLY_QUALITYMEASURE_IPFQR_HOSPITAL". Examine the data for "UNIVERSITY OF ALABAMA HOSPITAL". This is hospital ID code 010023. Not all time periods include new data. The date of reporting and the start and end date of data are not the same. Note that the field HBIPS-2_Overall_Num indicates the numerator for the measure "Hours of physical-restraint use." The denominator for the same overall measure is in the field HBIPS-2_Overall_Den. The dictionary provides the interpretation of these two fields as hours of restraint and number of patients examined. Since the number of patients examined changes during different time periods, you need to use a weighted grand average and a weighted standard deviation in calculation of upper and lower control limits. Note also that the upper and lower control limits are very close to each other because of the large samples per time periods.
Question 7: Find the value of standard normal variable z such that area under the curve below z is .3300 or .1003. z Calculator► Question 8: Variable X has a mean of 10 and standard deviation of 2 in the population. Calculate the z score that corresponds to X = 20.
Question 9: Variable X has a mean of 4 and standard deviation of 2 in the population. Find the value of X such that the corresponding z score for this value is -3.
Question 10: At a board meeting, you hear different statements about who the clinic is serving. According to the statements, 68% of the patients are under 25 years old and 10% are over 50 years old. Assuming that the patients are normally distributed, find the mean and standard deviation of the distribution.
Question 11: You are health administrator who is interested in examining organizational motivation and commitment of hospital employees. As part of a research project you have collected data from 16 employees serving in various wards of a hospital in a large metropolitan area. The following table provides information on Employee type (1 = trainee, 2 = supervisor, 3 = manager), Gender (1 = female, 2 = male), Training (0-10 scale), Motivation (0-10 scale), and Commitment (0-10 scale) of the 16 employees in your sample. Please make sure that you treat employees and gender as categorical variables and training, motivation and commitment as quantitative variables.
(a) Compute descriptive statistics for each variable. (b) Use Excel to perform a one sample test to evaluate whether or not the mean motivation level of all employees in the population is different from 5. The null hypothesis is that µ1 = 5; i.e. the population mean motivation level is equal to 5. The alternative hypothesis is that µ1 ≠ 5; i.e. the population mean motivation level is significantly different from 5. Calculate the mean (4.31) and the standard deviation (3.00) using functions in Excel. Calculate the t-statistic and its degrees of freedom. Calculate the critical value and test if the critical value is less than alpha of 0.05. Copy/paste relevant Excel output. Provide interpretation of "t" test results.
(c) Use Excel to perform a paired samples t-test to evaluate whether or not the mean Motivation level is significantly different from mean Commitment level in the population. The null hypothesis is that µ1 = µ2, i.e. the sample mean motivation level is equal to the sample mean commitment level. The alternative hypothesis is that µ1 ≠ µ2, i.e. the sample mean motivation level is significantly different from the sample mean commitment level. Test at alpha levels less than 0.05. Copy/paste relevant Excel output. Provide interpretation of t-test results. (d) Use Excel to perform an independent samples t-test (assuming equal variances) to evaluate whether or not the mean Motivation level differs significantly between male and female employees in the population. The null hypothesis is that µ1 = µ2; i.e. the sample mean motivation level for females is equal to the sample mean motivational level for males. The alternative hypothesis is that µ1 ≠ µ2; i.e. the sample mean motivation level for females is significantly different from the sample mean motivational level for males. Copy/paste relevant Excel output. Provide interpretation of t-test results. For this problem you can assume that a pooled variance test is appropriate and alpha level is 0.05. Question 12: Compare the performance of Medstar Washington to other DC based hospitals (excluding Medstar Georgetown) on overall satisfaction in Hospital Compare data using data from 2014 through today. What advice you have for the hospital administrator on where improvements are needed. Find the data in Hospital Compare site. One purpose of this assignment is to make sure that you can find the data online on your own. Download and analyze the data.
More
This page is part of the course on Statistical Process Improvement, the lecture on Comparison of Means. This course was created by Farrokh Alemi, Ph.D. on January 22, 2016 |
||||||||||||||||||||||||||||||||||||||||||||||||||||||||||||||||||||||||||||||||||||||