
Overview
Constructing probability models that if we act on the
advice of the model we see the expected model results
Video►
Objectives
- Create a counterfactual model of the data
- Estimate mediation effect in real and counterfactual models of the
universe
Assigned Reading
- Tutorial on using regression for network construction
Read►
(Use instructor's last name as password)
- Read about "Graphical Representation of Counterfactuals" in "Causal Inference in Statistics" pages 101-107
- Calculating mediated
effects through counterfactual models
Slides►
Narrated Slides►
Video►
YouTube►
- Mediation Analysis:
- Assume the following temporal order of variables: Covariate C1
first, Covariate C2 second, Exposure X third,
Mediator M fourth, and Outcome Y last.
- Learn network structure through chain of regressions
Slides►
Video►
YouTube►
- Learn network parameters and joint distribution of variables through regressions
Slides►
Video►
YouTube►
- Estimate un-confounded and average treatment effects of exposure
Slides►
Video►
YouTube►
- Re-estimate the impact of variables under counterfactual
assumptions.
Estimate mediation impact.
Slides►
Narrated Slides►
Video►
YouTube►
Assignment
Question 1: Use LASSO regressions to create the network of symptoms and COVID-19 diagnosis. Remove equations
that explain less than 10% of variation in the response variables. Remove coefficients
where the absolute value of coefficients are
equal or less than 0.05. Remove cycles, none should exists if
you always regressed response variables on independent variables that
occur prior to it.
From the network calculate the following
- What is the order of occurrences of the symptoms, age, gender, and results of COVID-19 laboratory tests?
- What are the direct predictors of COVID-19 Laboratory test results?
Assume the following order for the variables: D1: Age, D2: Female, X1:
Shivering, X2: Fatigue, X3: Loss of taste, X4: Fever, X5: Headaches,
X6: Loss of smell, X7: Chills, X8: Muscle aches X9: Diarrhea, X10:
Cough, X11: Shortness of breath, X12: Runny nose, X13: Sore throat,
X14: Loss of balance, X15: Vomiting, X16: Joint pain, X17: Loss of
appetite, X18: Wheezing, X19: Difficulty breathing, X20: Excessive
sweating, Y: COVID-19 Test Results.
- What is the best network that fits the data?
Establish the structure of the network ignoring regressions that explain less than
10% of the variation in test results and
ignoring variables where absolute value of coefficients are less than or equal to 0.05.
- Estimate the parameters of the network from repeated LASSO regressions.
Report the joint probability of COVID-19 positive test results, if we
do not know which symptoms were present.
- What are parents in the Markov blanket of Fever?
- Use regressions to identify these parents in Markov Blanket of Fever
- Use the network to read parents in Markov Blanket of Fever
- What is the un-confounded effect of fever on probability of positive COVID-19 diagnosis?
- Use inverse propensity weights to removing confounding
- Switch the distribution of direct predictors of Fever so that patients with and without Fever have the same distribution of direct predictors
- What is the parents in Markov blanket of Chills?
- Use Network to identify the parents in Markov blanket of Chills
- Use regressions to identify parents in Markov blanket of Chills
- LASSO regress Chills on its direct predictors, not including Fever.
Report intercept, coefficients, and McFadden R-square.
- Revise the network to create a counterfactual network in which Fever is not mediated by Chills (no arc from Fever to Chills)
- What is the mediated impact of fever on COVID-19 through Chills?
Resources for Question 1:
- Data Download►
- Yili Lin's Intelligent Tutor
Patriot AI►
- Team Teach One Slides►
Narrated Slides►
Code►
Intelligent Tutor►
- Rachael King's Teach One YouTube►
- Yatisha Rajanala's Teach One
Answers►
Real Network►
Counterfactual Network►
Code►
Netica Tables►
- Answers and overview of calculations Read►
- Analysis in the observed, "real," network, which includes a link from Fever to Chills
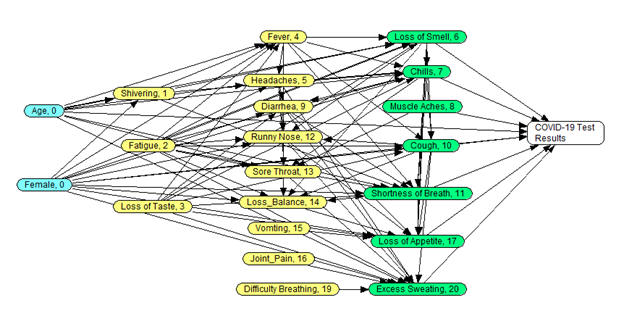
- This network was drawn from repeated LASSO regressions of the data, ignoring R-square < 0.10 and coefficients < 0.05.
Read►
- Netica network with associated tables
Zip►
- Analysis in the Counterfactual network, which excludes the link between Fever and Chills:
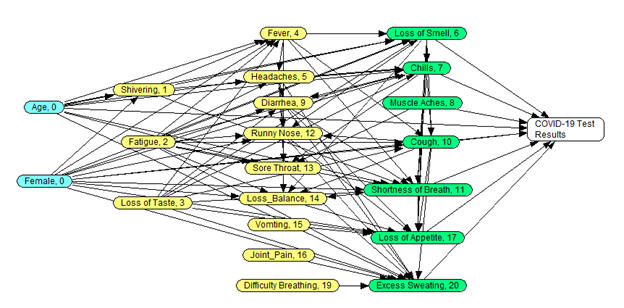
- Regression of Chills on prior predictors, excluding Fever as a predictor
Read►
- Revised table for predicting Chills
CSV
file►
- Netica network with associated tables
Zip►
- Percent of effect of Fever mediated through Chills
Excel►
Optional Question 2: What percent of the
average effect of dyslexia on passing the exam is mediated through
having a tutor? The following 5 variables were response variables
in 5 logistic regressions on all preceding variables: (1) passing the
exam, (2) having dyslexia, (3) having dyscalculia, (4) having tutor and
(5) completed all assigned problems. The estimated regression
coefficients and McFadden R2 is provided in the following table:
|
|
Passed Exam |
Dyslexic |
Dyscalculia |
Had Tutor |
Completed assignments |
|
Intercept |
0.30 |
0.6 |
0.85 |
0.15 |
0.49 |
|
Dyslexic |
0.20 |
|
|
0.85 |
|
|
Dyscalculia |
0.42 |
0.10 |
|
0.35 |
|
|
Had tutor |
0.25 |
|
|
|
0.82 |
|
Completed assignments |
0.70 |
|
|
|
|
|
McFadden R2 |
0.18 |
0.15 |
0.13 |
0.23 |
0.34 |
Construct a revised counterfactual model using the following
regressions.
|
|
Had tutor (counterfactual) |
|
Intercept |
0.13 |
|
Dyslexic |
Not
allowed in the regression |
|
Dyscalculia |
0.42 |
| McFadden R2 |
0.27 |
To answer this question, create twin models with one difference.
Create the structure of the model from the regressions. Estimate the
joint distribution of variables from the regression coefficients. Call
this the real model. Remove the link from Dyslexia to having a
tutor. And redo the model structure and parameters. Call this
the counterfactual model. Compare the change in passing the exam
associated with change in dyslexia status of the students. Report
the percent of change that can be attributed to having a tutor for
dyslexic students.
Resources
- Belina Sapkota's intelligent tutor
Prompt► (Add this file into your AI)
More
For additional information (not part of the required reading), please see the following links:
- Path analysis of mediation coefficient
Excel►
- Pearl's direct and indirect effects Read►
Web Appendix►
- Saeed's lecture
Video►
- Mediation analysis allowing for exposure-mediator interactions Read►
- Mediation analysis through stable weights
Read►
- Practical guide to mediation analysis
through inverse odds ratio
Read►
Slides►
- Mediation analysis revisited
Read►
This page is part of the course on Comparative Effectiveness by Farrokh Alemi, PhD Home►
Email►
|