 |
|
HAP 719: Advanced Statistics I |
|
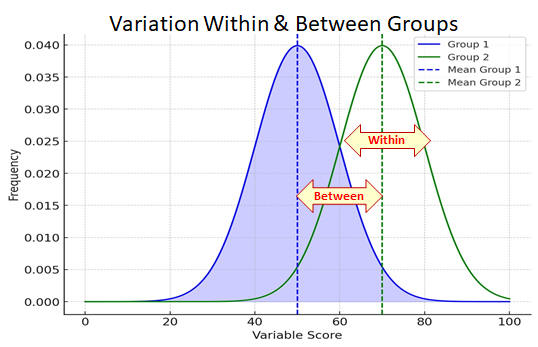
Analysis of Variance
OverviewIn this module, you will learn to differentiate between observational and random experimental designs within the context of ANOVA, and gain hands-on experience using One-Way and Two-Way ANOVA to analyze data. By mastering these techniques, you will be equipped to tackle complex data analysis challenges in your research and professional work, making you a valuable asset in any data-driven field. Additionally, you will develop the skills to interpret statistical outputs, enabling you to make informed decisions based on your analyses. ObjectivesAfter completing the activities this module you should be able to:
Lecture
AssignmentsAssignments are submitted on Canvas. They are graded as pass/fail. A summary 1-page word document should be included. In the summary, you should state if you were able to get the same answers as those provided. Your R, STATA, or Python code should be included in separate files. It is OK to help each other in doing the assignments but not OK to copy and paste work of others. It is OK to use ChatGPT or other large language models to generate the R code, but you must be transparent about it and report its use. Some assignments require large data, so you will have more data preparation skills -- an essential statistical analysis expertise. Peer teachers should submit assignments prior to the lecture. All others should submit following the lecture. Late assignments will lose 20% of the grade. Question 1:The data set you will be using for this assignment constitutes a subsample of a larger data set called 2011/2012 National Survey of Children’s Health (NSCH) which was conducted by the Centers for Disease Control and Prevention (CDC) and the National Center for Health Statistics. This survey included around 95,000 children between the ages of 0-17 years and its purpose was to measure children’s health status, insurance coverage, parental health and several other characteristics.
Resources for this question:
Question 2: Perform a one-way analysis of variance. A large percentage of people in the United States suffer from high levels of cholesterol. For the patient with high cholesterol levels, physicians prescribe drugs to reduce cholesterol levels. A pharmaceutical company has developed three such drugs. To find out if any statistical significant differences exit among three drugs, the researcher in the company conducted an experiment. The researcher selected 60 men, each of whom had cholesterol levels over 285. She randomly assigned 20 men in each treatment group. The drugs were administered over a three-month period and the reduction in cholesterol was recorded for each person.
Resources for this question:
Question 3: In universities there are often multiple lectures for the same introductory course each semester because of high demand. Consider a statistics department that runs three lectures of an introductory statistics course. We like to determine whether there are statistically significant differences in first exam scores in these three classes (shown as class A, B, and C). Describe appropriate hypotheses to determine whether there are any differences between the three classes, summarize available data, and use one-way ANOVA to check if there are differences among the performance of students in the three lectures of the same class. This question is from OpenIntro to Statistics.
Question 4: Does utilization in three rural hospitals differ significantly from each other? Resources for this question:
Question 5: Suppose we had patients with myocardial infarction in the following groups: –Group 1: A music therapy group –Group 2: A relaxation therapy group –Group 3: A control group. 15 patients were randomly assigned to the 3 groups and then their stress levels were measured to determine if the interventions were effective in minimizing stress. Identify whether the three groups differ and if so identify differences between any pair of groups. Resources for this question
More
|
|
 Construct the subsample that includes only children between the ages of 3-5 years old. Create a data frame in R for the
variables needed. Exclude variables not needed in answering the following questions. Address missing values. Check the distribution of the variables
and whether transformations are necessary:
Construct the subsample that includes only children between the ages of 3-5 years old. Create a data frame in R for the
variables needed. Exclude variables not needed in answering the following questions. Address missing values. Check the distribution of the variables
and whether transformations are necessary: