
Assigned Reading
- Association Networks: Chapter 19 in Statistical Analysis of Electronic Health Records by Farrokh Alemi, 2020
- Causal Networks: Chapter 20 in Statistical Analysis of Electronic Health Records by Farrokh Alemi, 2020
- Using LASSO regression: Constructing causal networks through regression
Read►
YouTube►
Slides►
- Using regression to estimate joint distribution of variables
Slides►
Video►
(see alcopso example with Netica tables Slides►)
- Comparison of vocabulary of multiple regression and network models
Slides►
YouTube►
Assignment
Include in the first page a summary page. In the summary page
write statements comparing your work to answers given or videos. For
example, "I got the same answers as the Teach One video for question 1."
Question 1: This lecture shows how regressions can be
used to identify a network structure. The basic idea is that one
regress a response variable (one of the nodes in the network) on all
variables that precede it. Thus, the independent variables are all
preceding variables. The statistically significant variables (in
case of LASSO regression, the non-zero variables) in the regressions
indicate the parents in the Markov Blanket of the variable. And the
collection of all parents in Markov Blanket identify the entire network
structure. Write out the set of equations that can identify the following network:
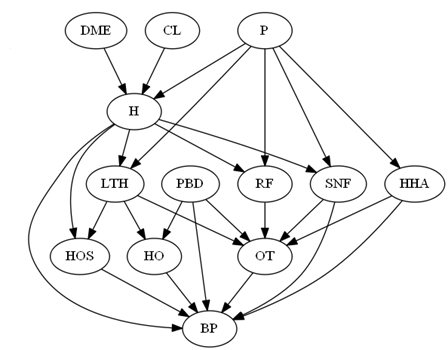
In each instance write all the variables that are
in the regression equation. These include the response
(dependent) and the independent variable. Mark with * the
independent variables that have a
statistically significant (non-zero) relationship with the response
variable. For example, LTH is regressed on all variables
that precede it which are DME, CL, P and H. But only P and
H have a statistically significant relationship with LTH.
This regression can be shown as: LTH = a + b DME + c CL + d P* + e H*
Resources for Question 1:
Question 2: Construct a Bayesian probability network model that would
predict success with antidepressants. A network model will include
variables, and mediators of the effect of variables, on response to
the antidepressant. Include all baseline diagnoses and gender as
covariates. Assume that gender occurs before baseline
diagnoses. Baseline diagnoses occur before any treatment. Assume that antidepressant treatments occur
before report of remission and in the
following order:
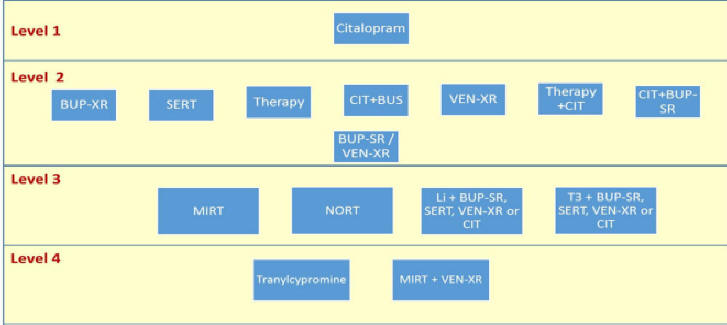
Remission should be considered an end node. Gender is a
root node. All other variables, e.g. diagnoses, could be either
root or intermediary nodes but all occur prior to use of
antidepressant. The antidepressants that were given prior to an
antidepressant should be used as a covariate. The data has been
modified to report per person data, without visit-based weekly data.
- Identify the parents in the Markov blanket of citalopram using LASSO regression. The response variable is citalopram (not CIT). The
independent variables are all variables that occur prior to citalopram: baseline diagnoses and gender. Rely on Lambda value of 1 standard error, 1se.
- Identify parents in Markov blanket of remission through LASSO regression. The response variable is remission. The
independent variables are all variables that occur prior to remission: gender, baseline diseases, and citalopram. Evaluate the model at
lambda of 1se, that is lambda.1se and not lambda.min.
- Download Netica software. This software is free for use with networks with less than 15 nodes. Make a node for each variable in the
two regressions you made in step (a) and (b). The node should have exactly the same name as the variable in the data. Capitalization
matters. Spelling matters. To make the variable display better, you can add a description that corrects for the lack of capitalization or
replaces dash line with space. Nodes should have the same levels as the variable in the data. In most cases, these levels are 0 and 1.
You can enter a descriptive level to accompany the numerical level. Using Netica software
draw a line from each independent variable in the two regressions to the response variable in the two regressions.
- Using Netica software, estimate the parameters of the network you have created. Fit the data to the model you have created in
Netica. Use Cases, Learn, and Incorporate Case File. Once all cases have been incorporated use the thunderbolt sign to compile the model.
This will set the tables within all nodes. The software will estimate the parameters for the model you have created. The following image
shows how you can incorporate the case file into Netica. Keep in mind that nodes that have 50% change of being present or absent are likely
to indicate a variable that did not match with the name in the data file.
- Predict the effect of citalopram on remission for patients who have neurological disease and PTSD. This means that in Netica you select patients who
have these two conditions and then you compare the probability of remission for patients treated and not treated with citalopram.
Resources for Question 2:
Question 3: Inside an electronic health record, there
are data on outcomes of a particular intervention. Using the network
drawn below, write the equations that would allow you to estimate what
would happen if the intervention was not given. First, write an
equation for each node in the network based on that variables that precede
it and indicate the significant relations with an astric.
Resources for Question 3:
- The regression equation for predicting whether
there is an adverse event is given by regressing Adverse Outcomes on
all prior variables which are Severity, DNR, Treatment and Provider's
decision. The resulting equation will have 2 variables which
have a statistically significant non-zero relation to outcome: Outcome = a + b Treatment* + c Severity*
+d DNR + e Provider.
- Velosky"s Teach One
YouTube►
- Christine Koehmstedt's Teach One YouTube►
Intelligent Tutor►
Copy paste into your AI
- Yili Lin's Intelligent Tutor
Patriot AI►
Question 4: The following graph was used to simulate data on bundling payment for total hip fracture treatment.
Recover the original network from the data using LASSO regression and calculate the causal impact of H on BP using Netica.
Resources for Question 4:
Optional Question 5: The following data show for how many patients
a
disease occurs before another. For example, for 21 patients disease D occurs
before disease N, and for 24 patients the reverse order occurs. There is no patient
in our sample where both U and M have occurred in the same person. Which of the following statements are
correct, if we consider the relationship between these two diseases and
the rest of the diseases?
- U occurs before M, when and if they both occur in the same patient
- M occurs before U, when and if they both occur in the same patient
- There is not sufficient information to know the temporal order of U
and M
|
|
D
|
M
|
N
|
U
|
V
|
|
D
|
|
7
|
21
|
7
|
0
|
|
M
|
52
|
|
34
|
|
7
|
|
N
|
24
|
16
|
|
7
|
30
|
|
U
|
38
|
|
5
|
|
14
|
|
V
|
45
|
27
|
3
|
52
|
|
Resources for Question 5:
Question 6:
Draw a network that explains
variation in Y from its direct, and indirect, causes.
Draw the network based on the following 5 ordinary regressions.
Assume that LASSO regression will keep the statistically significant
variables as non-zero variables. Statistically significant variables are indicated by a
circle.
Y occurs after all other variables. Information
is not available on whether Xs occur after one another.
Make sure that you remove cycles. When an interaction of two
variables is significant, keep track of both variables in your Tables.
R squared less than 5% and coefficients less than or equal to
0.05 can be ignored.
Resources available for question 6:
- Chain of regressions, removing cycles, network structure, estimating joint distributions
Slides►
- Ghaida's Teach One YouTube►
Slide Show►
- Jackelyn Segura's Intelligent Tutor
Word► (add into your own AL platform)
Optional Question 7: Using the following set of regressions,
determine the network structure and estimate the parameters of the
network. Create a Netica file, then calculate the causal impact of exposure X on outcome
Y.
|
|
Outcome |
Covariate |
Covariate |
Exposure |
Mediator |
|
Y |
C1 |
C2 |
X |
Z |
|
Intercept |
0.3 |
0.6 |
0.85 |
0.12 |
0.45 |
|
Covariate C1 |
0.12 |
|
|
0.85 |
|
|
Covariate C2 |
0.22 |
|
|
0.35 |
|
|
Exposure X |
0.15 |
|
|
|
0.82 |
|
Mediator, Z |
0.4 |
|
|
|
|
|
|
|
|
|
|
|
|
McFadden R2 |
0.18 |
0.12 |
0.13 |
0.23 |
0.34 |
Resources available for answering question 7:
- Using regression to estimate joint distribution of variables
Slides►
Video►
More
For additional information (not part of the required reading), please see the following links:
- Learning Bayesian networks from correlated data Read►
- Comparison of Bayesian network and logistic models Read►
- Graphical LASSO
This page is part of the course on Causal Analysis by Farrokh Alemi, Ph.D.
Course Home►
Email►
|